German online furniture retailer, 156 weeks of orders and three media channels, asked what doubling media spend next year would deliver.
A composite case, built from the kind of file we see most weeks. An online furniture retailer in Germany, about 9,000 orders a week, with three paid channels: online video, paid social and search. Over three years, total media spend moved between €40k and €118k a week, around an average of €85k.
The business had a new majority owner, and the owner had a proposal: "Double media next year. Tell us what it does to orders."
This is the last step of the Planning Path, the one where the baseline gets bent by a decision. The simulator answered, as it always does. Most of the work was explaining which part of the answer the data stood behind.
What the file looked like
156 weekly rows: orders, spend by channel, average price, a promotions flag, and a column for public holidays. Spend varied well inside its range: quiet summer weeks near €40k, the autumn push near €118k, everything in between reasonably often. That variation is why the underlying model was trustworthy where it had data.
What the file did not contain was a single week anywhere near €170k. Doubling the average puts almost every week of the plan above the highest week ever run.
What the simulator did
Scenario Simulation is not a new model. It uses the fit from Contribution Decomposition: each channel goes through a geometric adstock, so spend keeps working for a few weeks after it runs, and then through a Hill curve, an S-shaped saturation in which each extra euro buys less than the one before. One regression estimates how much each transformed channel contributes.
It looks 26 weeks ahead, so the question became the first half of next year. Business as usual repeats last year's media week by week over those 26 weeks. The scenario multiplies it by two. To give a range, the simulator draws the coefficients 1,000 times from their estimated uncertainty and reports the 10th to 90th percentile.
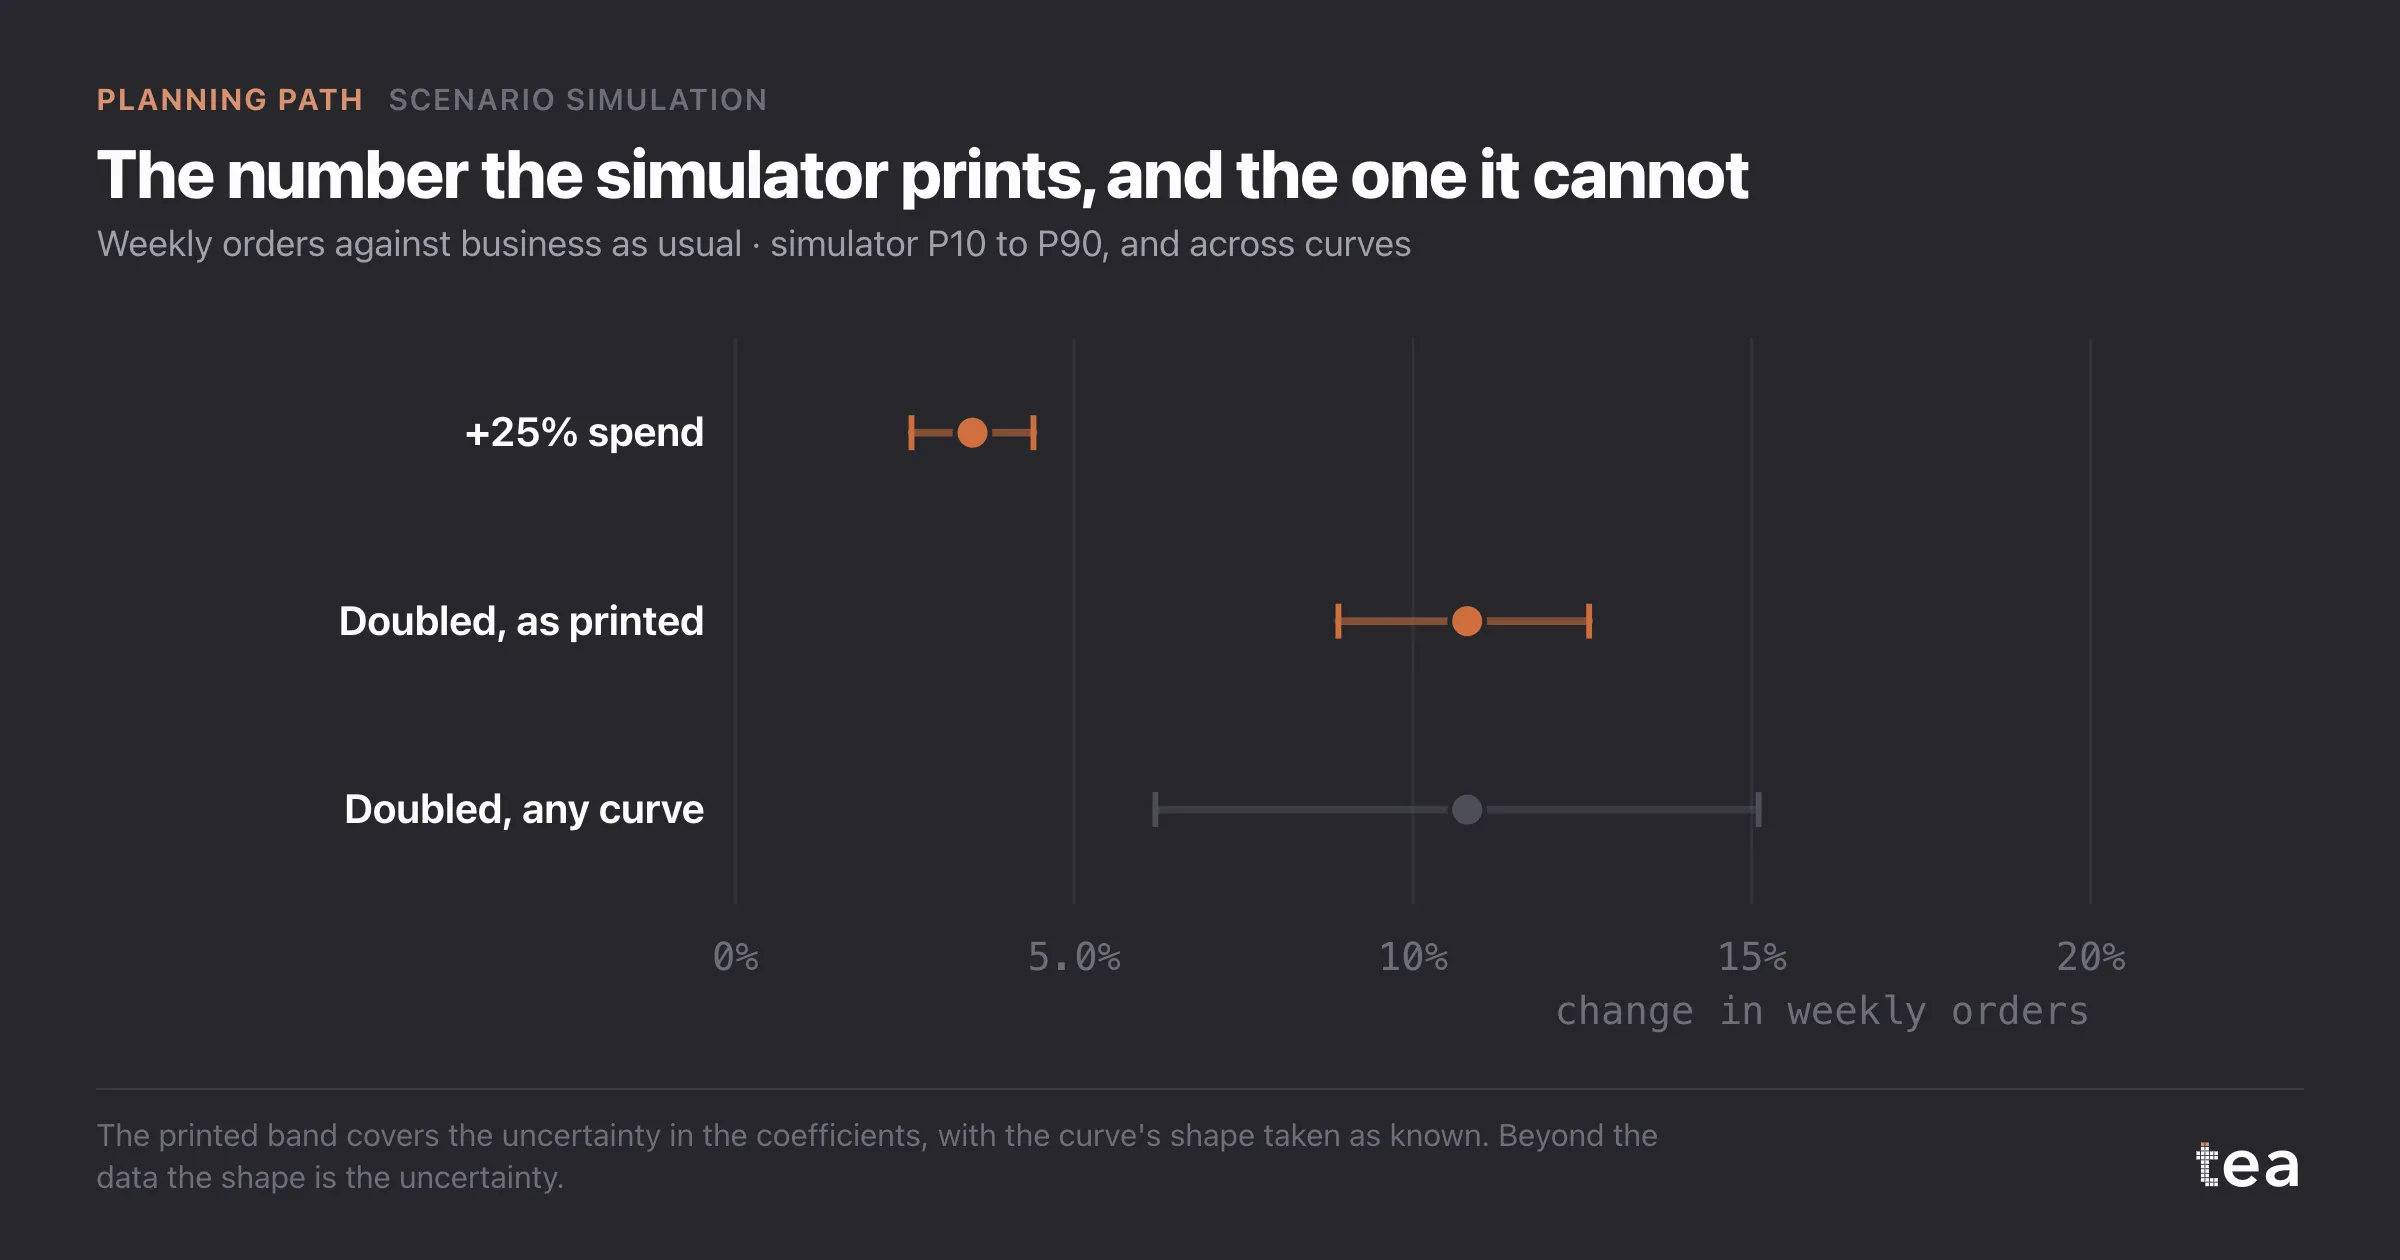
The printed answer: +10.8% orders, P10 to P90 from +8.9% to +12.6%. For comparison, a 25% increase came out at +3.5%, from +2.6% to +4.4%.
The simulator also printed a warning next to the doubled scenario: 25 of the 26 weeks of the horizon put at least one channel more than a tenth of its historical range above its highest observed week. It does not hide that, and the warning is the most important line on the page.
What the number cannot carry
The P10 to P90 band covers uncertainty in the coefficients. The shape of each Hill curve, where it bends and how flat it gets, is taken as known. Inside the observed range that is a fair simplification, because the data pins the shape down. Outside it, the shape is the whole question.
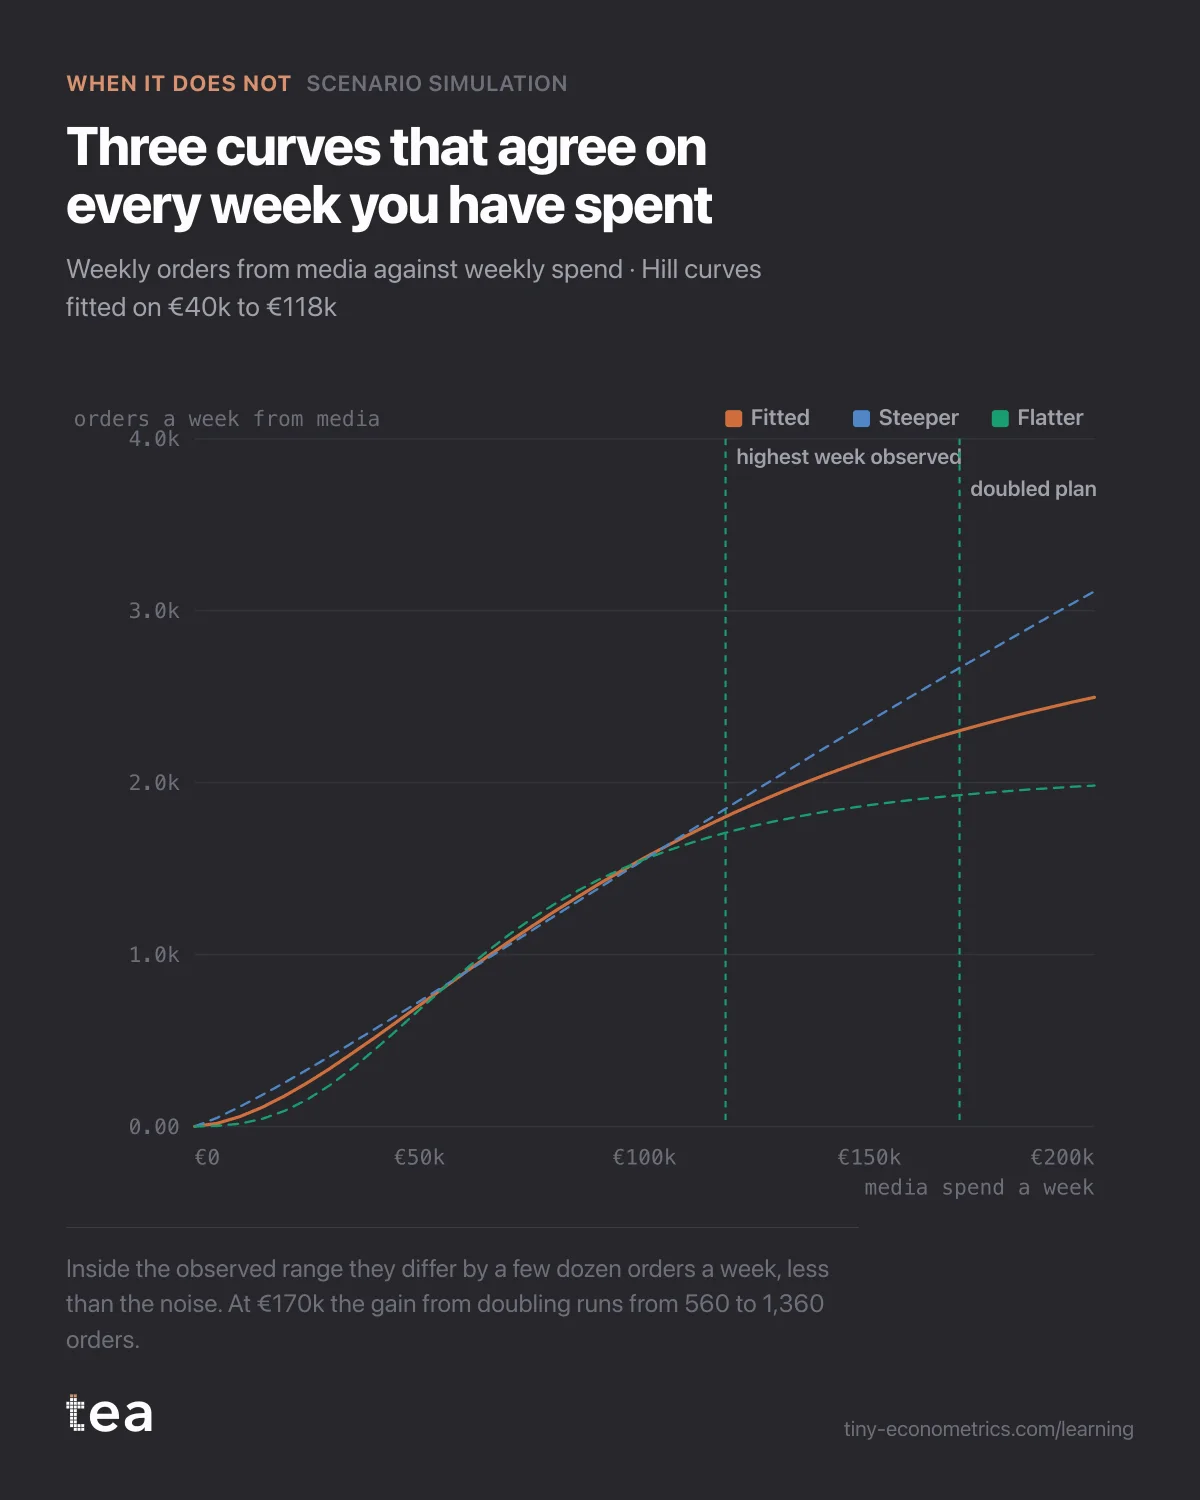
To see how much, we fitted alternative curves to the same observed range. A steeper one, which keeps rising past €118k, and a flatter one, which saturates soon after. Between €40k and €118k all three sit within a few dozen orders a week of each other, well inside the weekly noise: the data has no way to prefer one. At €170k they diverge.
- Fitted curve: doubling adds about 970 orders a week, +10.8%.
- Steeper curve: about 1,360, +15.1%.
- Flatter curve: about 560, +6.2%.
The cost of each extra order, the number a doubling decision actually hangs on, runs from about €62 on the steep curve to about €152 on the flat one. One of those is a good investment and one is not, and the file cannot say which world the business lives in.
So the verdict is nuanced. The simulator helps with the +25% scenario, which stays almost entirely inside the data, and with the direction of the doubled one: more orders, at a falling rate. It does not help with the size of the doubled one. The printed +10.8% is the fitted curve extended into a region with no observations. Presented alone, it would have looked more certain than it is, and the budget would have been signed on the shape of a curve nobody has seen.
What to do instead
- Step up instead of jumping. Raise spend by 25 to 30% for a quarter. That extends the observed range to around €150k on the busiest weeks, and the next refit can see where the curve actually bends.
- Test the top of the range on purpose. Double spend in a few regions for eight to ten weeks and hold the rest at plan. With a region column in the file, Geo / Segment MMM can read the contrast directly, and the doubled regions become observed data rather than extrapolation.
- Decide on the cost per extra order, not on the total. Agree in advance the cost at which more media stops paying, and let the test say whether the business is above or below it.
The lesson
A simulator always returns a number, including for questions the data has never seen. The interval around it only covers what the model knows it does not know. When a scenario pushes a driver beyond anything in the history, the honest answer is the range of shapes the data allows, and the cheapest way to narrow it is to go and observe the spend you are thinking about.
tea, the product
Your file, this question
Fifteen analyses on a CSV of weekly data, with the intervals and the diagnostics shown, and a plain sentence when the data cannot answer. Free while in beta, by invitation.
Request a place in the beta→tea, the product
Fifteen econometric analyses on your own CSV: Scenario Simulation, saturation curves, elasticities, budget allocation. Intervals and diagnostics shown, and a plain sentence when the file cannot answer.
Free while in beta, by invitation.
Request a place in the beta →Liked this? Run it on your own data.
tea runs Scenario Simulation and fourteen other analyses on any weekly CSV, in minutes. Free while in beta, by invitation.
The Planning Story
- A baseline forecast for the budget: 3% of the 8% was already coming
- When the past is not a baseline: forecasting after a lost account
- Three-year forecast from 26 months of data: say the horizon out loud
- Weekly demand forecasting with ARIMA: setting stock on the interval
- Measuring a one-off event: why one sponsorship cannot be isolated
- Seasonal indices with a weather control: stop planning on last March
- Doubling media spend in a scenario: what a simulator cannot know