Learning, the notebook of tea

Share of voice when your monitoring service misses digital spend
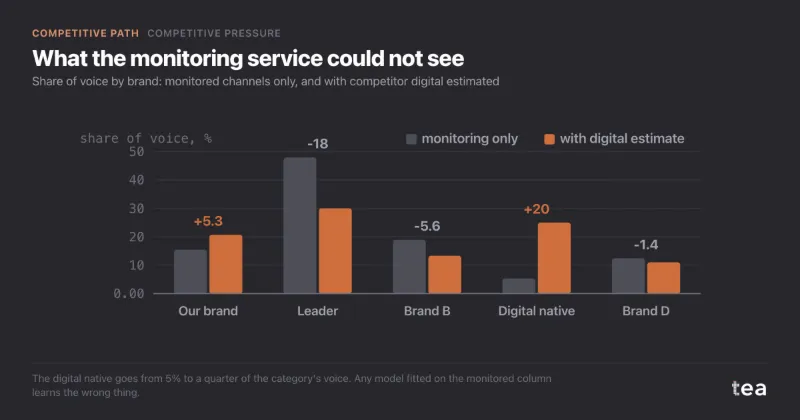
UK mattress brand, about £38M a year, asking whether a 30% share of voice meant it could cut £1M of media.

A composite case, built from files we see more often than we would like: a UK mattress brand selling mostly direct, about £38M of annual revenue, in a category of five brands where it holds roughly 17% of value share.

Continue reading →

Filed under Competitive Pressure  |  Competitive Path  |  Permalink
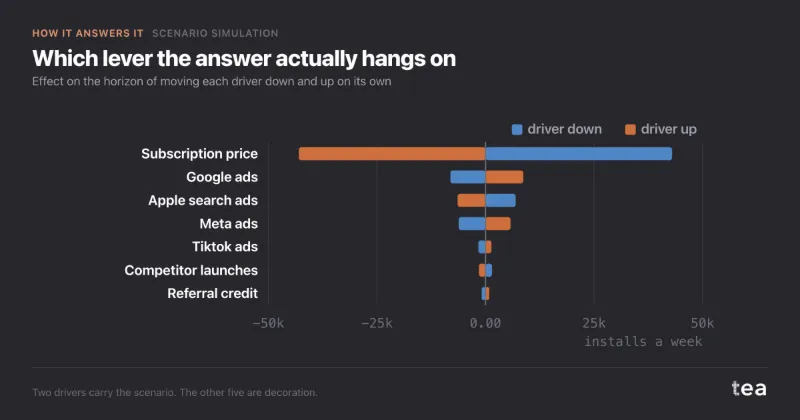
Scenario simulation: testing a budget shift before you commit

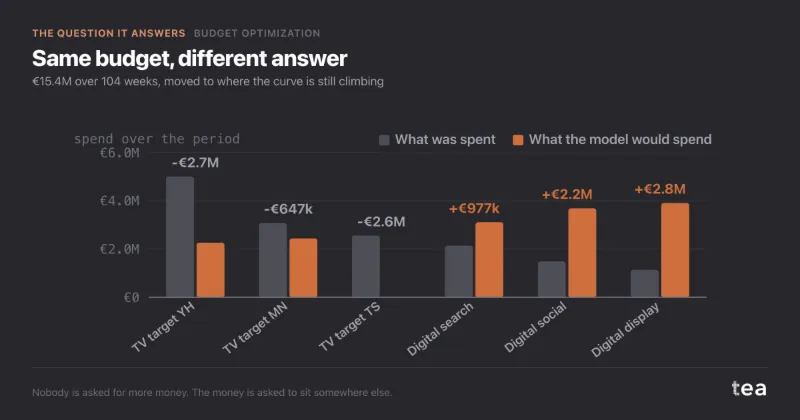
Move a quarter of the budget from Meta to Google. Same total spend. What happens?

This is the answer, and the answer is almost nothing.

Continue reading →

Filed under Scenario Simulation  |  Permalink

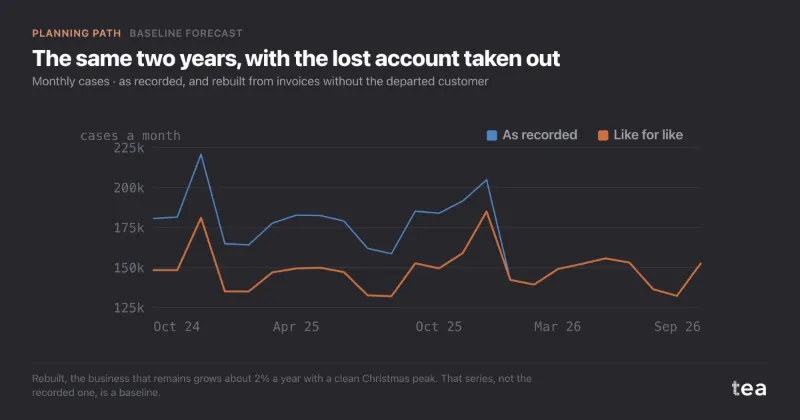
When the past is not a baseline: forecasting after a lost account

Italian fresh-pasta producer, 104 weeks of cases shipped, one key account lost mid-way, asked for next year's business-as-usual volume.

A composite case, built from the kind of file we see most weeks. A fresh-pasta producer in Emilia, about 140 people, shipping to supermarket chains in Italy and Austria. One of those chains, a discounter, moved its fresh pasta to private label and took its last delivery in mid-December 2025. It had been about 18% of volume.

Continue reading →

Filed under Baseline Forecast  |  Planning Path  |  Permalink

Cost per GRP vs return: why the dearest TV slots work the least

The dearest GRP works the least.

Eight TV dayparts from a €2M plan, plotted over two years. Cost per GRP on the horizontal axis, on a log scale because the prices span a factor of seventeen. What each euro gave back on the vertical. The size of each bubble is how many GRPs that slot actually buys inside the plan.

Continue reading →

Filed under Budget Optimization  |  Permalink

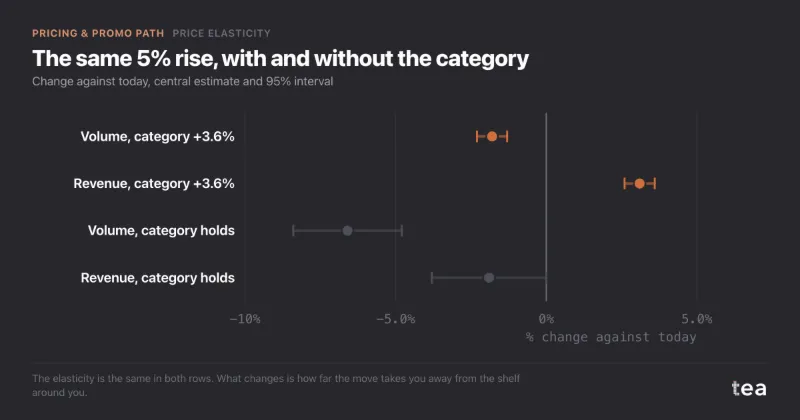
Price elasticity of -1.4 and why a 5% price rise still paid

Household-goods maker, one washing-up liquid SKU in Italian grocery, asking whether a 5% list-price rise would cost volume.

A composite case, built from the kind of file we see most weeks. A mid-sized household-goods maker, and its biggest line: a one-litre washing-up liquid sold through Italian grocery, about 42,000 bottles a week at €3.49 on the shelf. Around €7.6M of revenue a year from one SKU, so every decimal on its price is a meeting.

Continue reading →

Filed under Price Elasticity  |  Pricing & Promo Path  |  Permalink

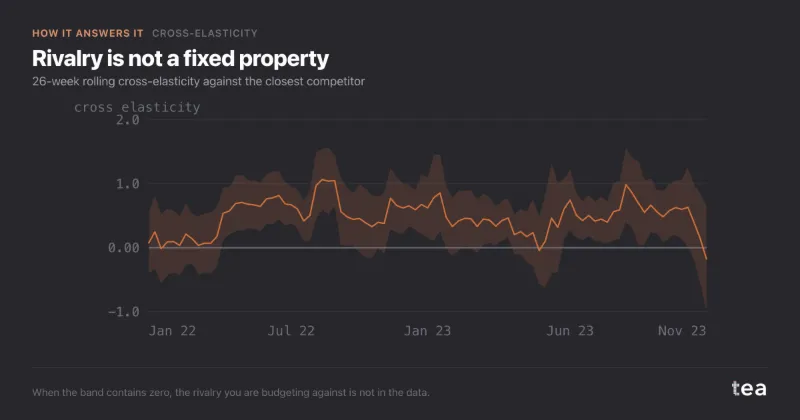
Cross-price elasticity: telling real rivals from shelf neighbours

Two competitors on the shelf next to you. One of them is a rival. The other one just sells nearby, and this chart is how you tell them apart.

Competitor A: cross-elasticity 0.49, with a 95% interval from 0.37 to 0.61. When their price goes up 1%, your volume goes up about half a percent. That is a substitute, and it is the brand you are actually competing with.

Continue reading →

Filed under Cross-Elasticity  |  Permalink

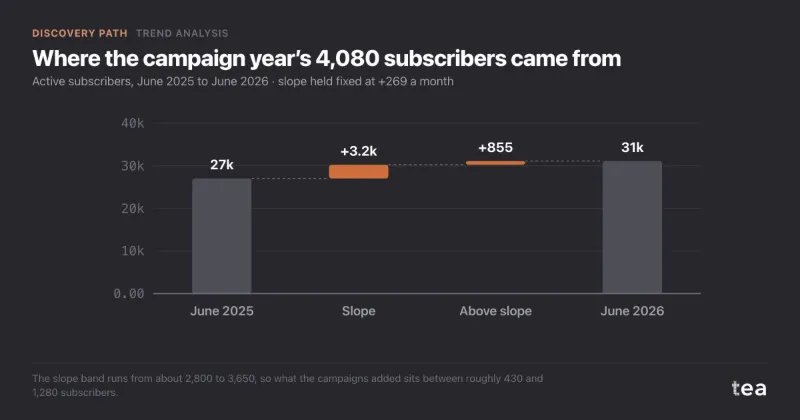
Subscription growth from marketing, or a slope already there

Coffee subscription business in the Netherlands and Belgium, 36 months of active subscribers, asked whether doubling campaign spend doubles growth.

A composite case, built from the kind of file we see most weeks. A coffee subscription business selling in the Netherlands and Belgium, around 31,000 active subscribers, a monthly box, and a first year of paid campaigns behind it.

Continue reading →

Filed under Trend Analysis  |  Discovery Path  |  Permalink

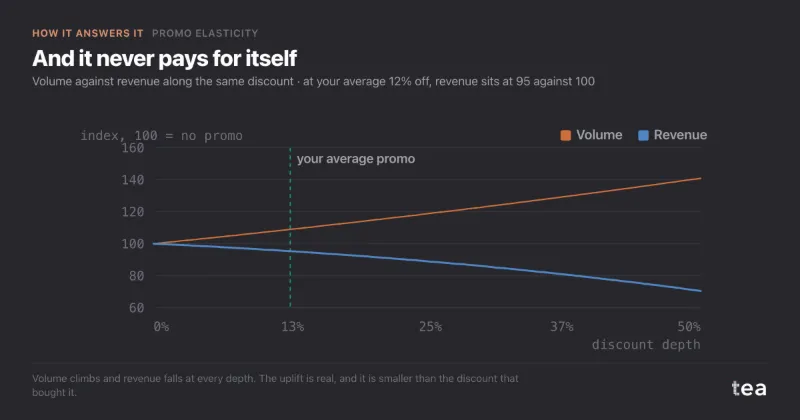
Promotional elasticity: what each point of discount buys in volume

Six years of rate discounts against shipped volume at a logistics operator. The curve is what the discount buys.

The semi-elasticity is 0.69. Each ten points of discount moves about 7% more volume. R² is 0.96, so the relationship is not in doubt: the discount works.

Continue reading →

Filed under Promo Elasticity  |  Permalink

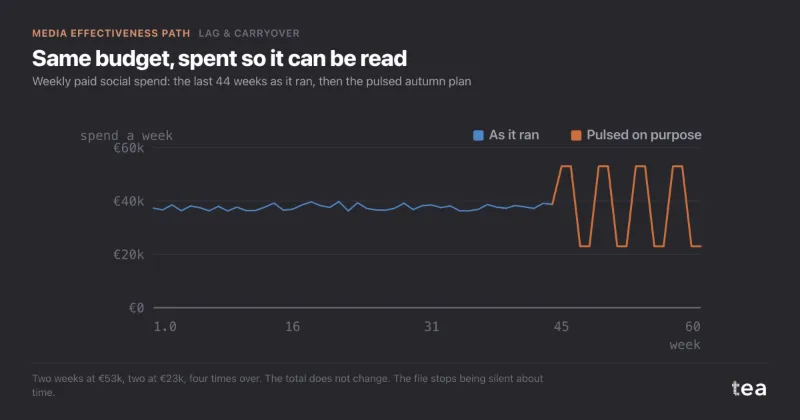
Why flat always-on spend makes carryover impossible to measure

Online home-insurance broker in Spain, always-on paid social at about €38k a week, asking what an August pause would cost.

A composite case, built from the kind of file we see most weeks. An online home-insurance broker in Spain, selling direct, with paid social as its largest channel. Spend had sat at about €38k a week for seventy weeks. Leads, meaning quote requests, ran at around 4,200 a week.

Continue reading →

Filed under Lag & Carryover  |  Media Effectiveness Path  |  Permalink

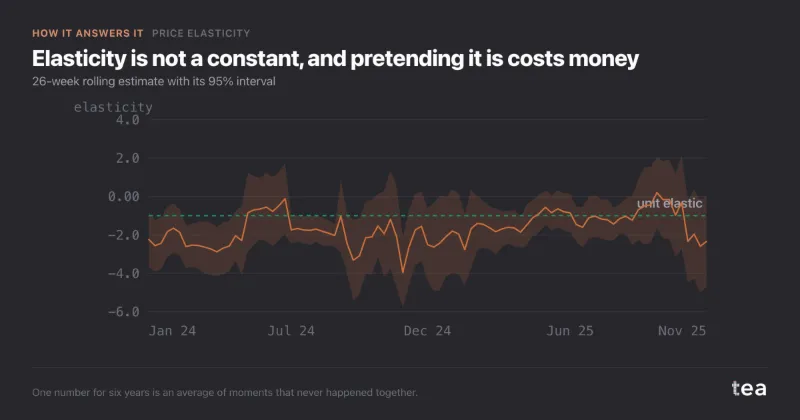
Price elasticity of demand: what a 1% price rise really costs

Six years of price against volume for a grocery product. Every grey dot is a week. The line is what the model thinks the relationship is.

The elasticity is -1.52, with a 95% interval from -1.85 to -1.18.

Continue reading →

Filed under Price Elasticity  |  Permalink