Thread · Planning Story

What does next year look like if we do nothing?

The business-as-usual number, built well enough to defend in a budget meeting, and then bent by the decisions you are actually considering. The path runs Baseline Forecast, Time Series (ARIMA), Seasonality & Event Impact, Scenario Simulation.

Here, one case per post, in reading order: where each step changed a decision, and where the file could not answer.

A baseline forecast for the budget: 3% of the 8% was already coming
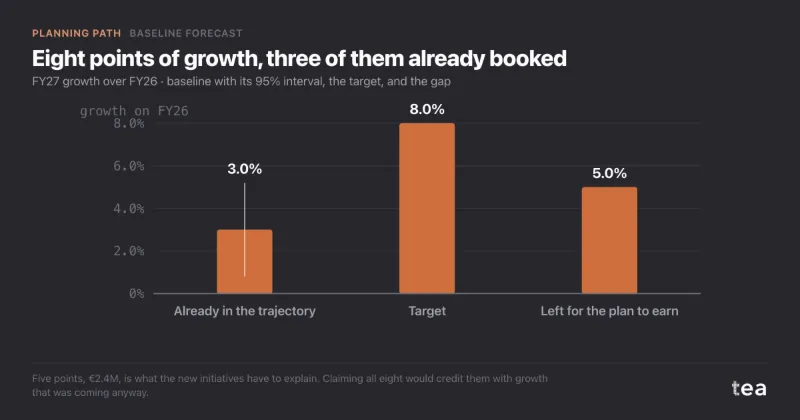
German and Austrian homeware retailer, €48M revenue, 156 weeks of sales, asked how much of an 8% target the new plan had to earn.

A composite case, built from the kind of file we see most weeks. A homeware and kitchenware retailer with 22 stores in Germany and Austria and a webshop that does a little over a quarter of revenue. The fiscal year runs October to September. FY26 closed at €48.0M.

Continue reading →

Filed under Baseline Forecast  |  Planning Story  |  Permalink
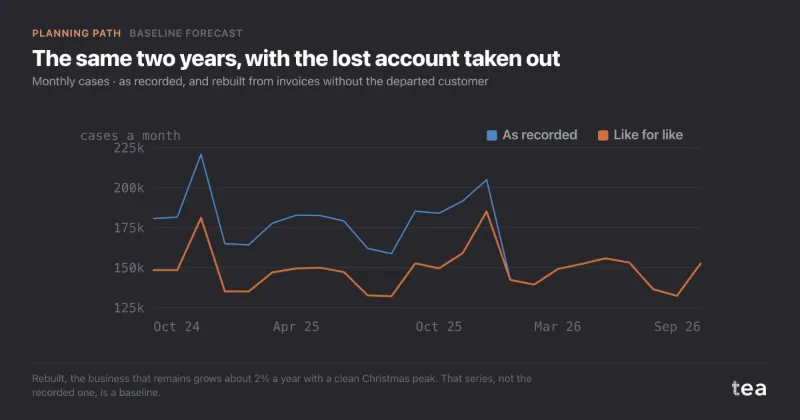
When the past is not a baseline: forecasting after a lost account

Italian fresh-pasta producer, 104 weeks of cases shipped, one key account lost mid-way, asked for next year's business-as-usual volume.

A composite case, built from the kind of file we see most weeks. A fresh-pasta producer in Emilia, about 140 people, shipping to supermarket chains in Italy and Austria. One of those chains, a discounter, moved its fresh pasta to private label and took its last delivery in mid-December 2025. It had been about 18% of volume.

Continue reading →

Filed under Baseline Forecast  |  Planning Story  |  Permalink
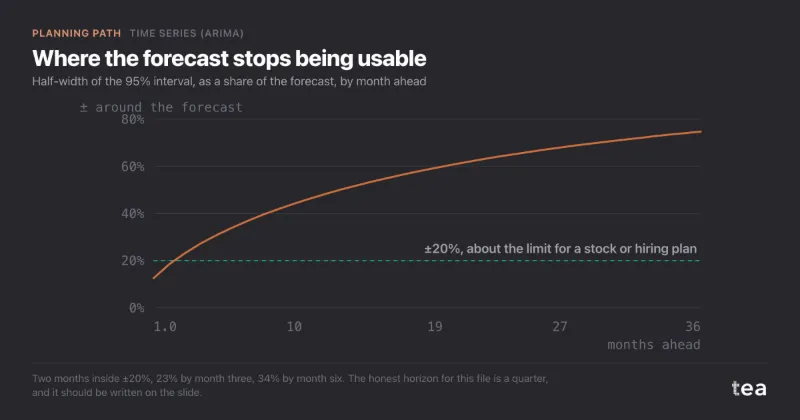
Three-year forecast from 26 months of data: say the horizon out loud

Spanish direct-to-consumer pet-food subscription, 26 months of monthly orders, asked for a three-year monthly forecast for a funding round.

A composite case, built from the kind of file we see most weeks. A direct-to-consumer pet-food subscription in Spain, launched in August 2024. Twenty-six months later it ships about 18,400 orders a month, and it is preparing a funding round.

Continue reading →

Filed under Time Series (ARIMA)  |  Planning Story  |  Permalink

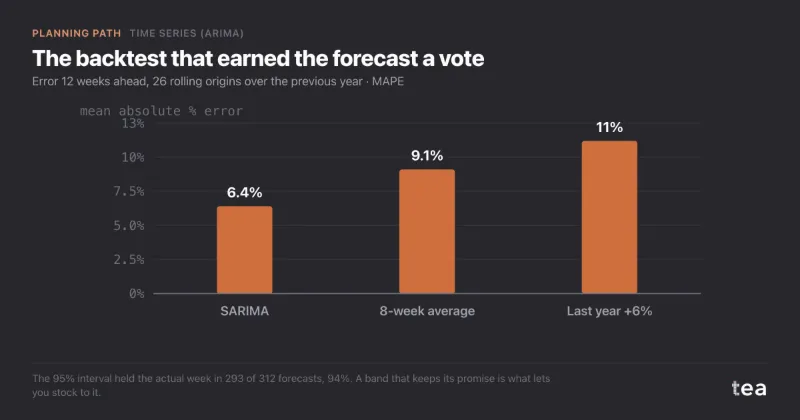
Weekly demand forecasting with ARIMA: setting stock on the interval

Dutch and Flemish foodservice distributor of frozen bakery, 182 weeks of cases shipped, asked how much safety stock the Christmas quarter needs.

A composite case, built from the kind of file we see most weeks. A foodservice distributor of frozen bakery products in the Netherlands and Flanders, delivering to about 1,900 cafés, hotels and canteens. Around 10,800 cases go out in an average week, at a stock cost of about €38 a case.

Continue reading →

Filed under Time Series (ARIMA)  |  Planning Story  |  Permalink

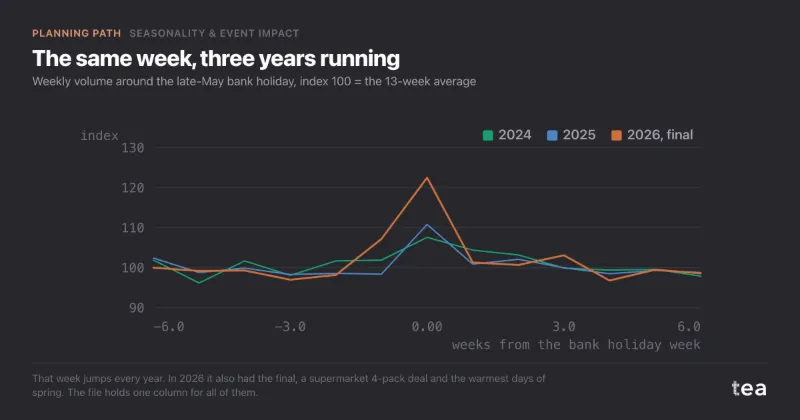
Measuring a one-off event: why one sponsorship cannot be isolated

Northern English craft brewery, 156 weeks of volume, sponsored a single regional cup final, asked for the uplift before deciding on renewal.

A composite case, built from the kind of file we see most weeks. A craft brewery in the north of England, selling through about 600 pubs and two supermarket chains. In late May 2026 it sponsored a regional cup final: pitch-side boards, the name on the match programme, and a mention in the regional broadcast.

Continue reading →

Filed under Seasonality & Event Impact  |  Planning Story  |  Permalink

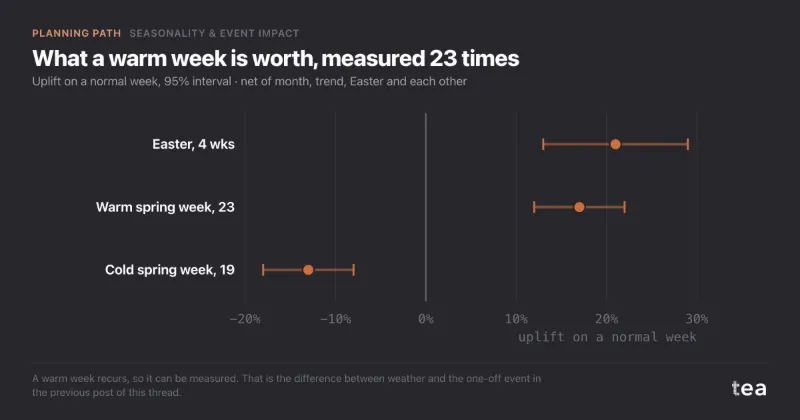
Seasonal indices with a weather control: stop planning on last March

UK garden-centre chain, 46 stores, 209 weeks of sales plus weekly temperature, asked how to plan the spring without planning on last spring's weather.

A composite case, built from the kind of file we see most weeks. A chain of 46 garden centres across the Midlands and the south of England. Spring is the year: March to June carries close to half of plant sales, and plants are bought from growers months ahead, with little room to send them back.

Continue reading →

Filed under Seasonality & Event Impact  |  Planning Story  |  Permalink

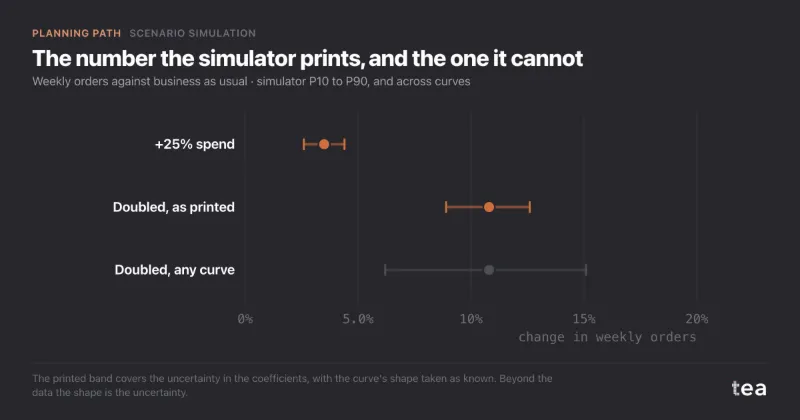
Doubling media spend in a scenario: what a simulator cannot know

German online furniture retailer, 156 weeks of orders and three media channels, asked what doubling media spend next year would deliver.

A composite case, built from the kind of file we see most weeks. An online furniture retailer in Germany, about 9,000 orders a week, with three paid channels: online video, paid social and search. Over three years, total media spend moved between €40k and €118k a week, around an average of €85k.

Continue reading →

Filed under Scenario Simulation  |  Planning Story  |  Permalink