Contribution decomposition: when price takes away what media adds
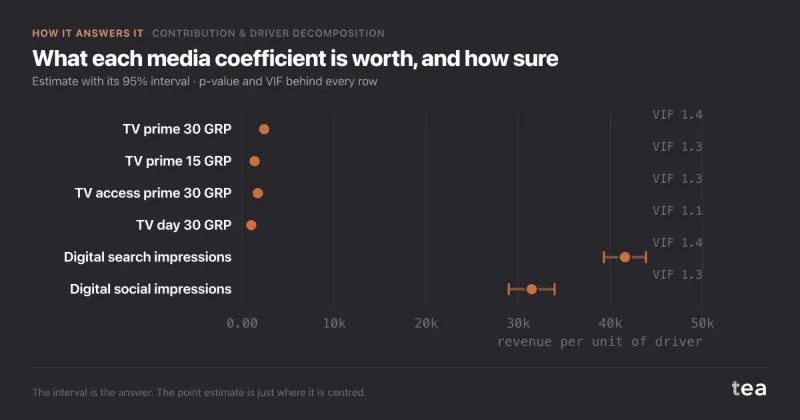
Two years of grocery revenue, split by what moved it. Thirteen drivers, in euros, with structural demand left out so the rest is readable.
Three of the thirteen sit below the line. That is the part of this chart most reporting does not have, because most reporting only counts the things that helped.
Filed under Contribution & Driver Decomposition | Permalink