Archive for the category

Budget Optimization

Moving the same budget to where the next euro returns most, under real constraints, and knowing when a recommendation is too thin to follow. How to read it, and where it misleads. How it works in tea.

A step of the Media Effectiveness Story.

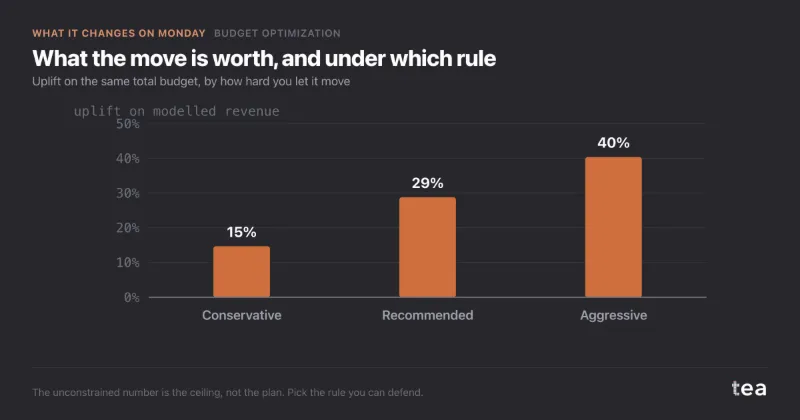
Budget optimisation scenarios: conservative, recommended, aggressive
Three numbers, three rules, one budget. This is the chart that decides how much of the model's advice you are actually going to take.

Conservative: 14.7% uplift. Recommended: 28.8%. Aggressive: 40.0%.

Continue reading →

Filed under Budget Optimization  |  Permalink
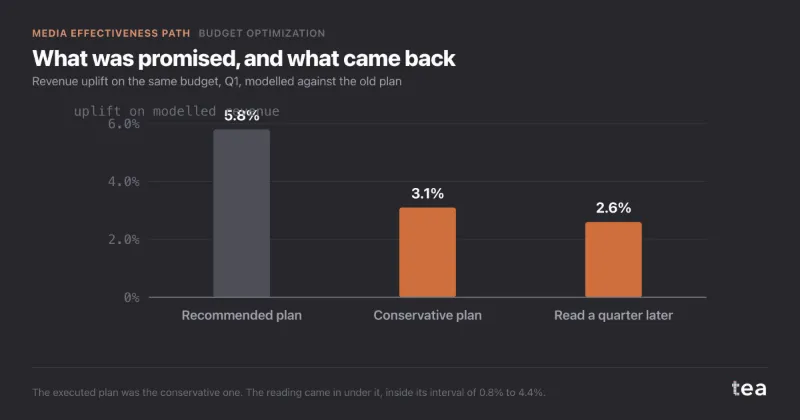
A media budget reallocation, executed and read a quarter later

Pet-food brand in Germany, €9.6M of media a year, asking whether the same budget could do more next year.

A composite case, built from the kind of file we see most weeks. A pet-food brand selling through German grocery and online, €9.6M of media a year across TV, online video, paid search, paid social and outdoor.

Continue reading →

Filed under Budget Optimization  |  Media Effectiveness Story  |  Permalink

When a budget optimiser says move 60% into one channel

Consumer electronics retailer in the Netherlands, €6.2M of media a year, asking whether to follow an unconstrained reallocation.

A composite case, built from the kind of file we see most weeks. A consumer electronics retailer in the Netherlands, 60 stores and a large web shop, €6.2M of media a year: €2.2M on TV, €1.2M on online video, €0.9M on outdoor, €0.7M each on radio and paid search, €0.5M on social.

Continue reading →

Filed under Budget Optimization  |  Media Effectiveness Story  |  Permalink

Equal marginal returns: how a budget optimiser actually works

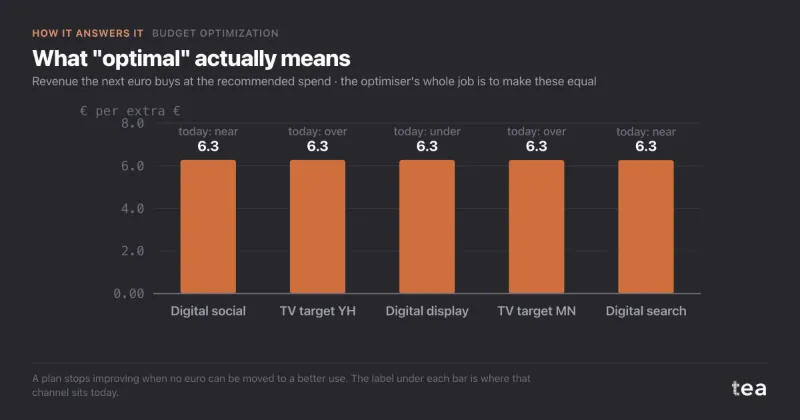
Five bars, all the same height. That is not a broken chart. That is the definition of an optimal plan, and it is the clearest thing I know for explaining what an optimiser actually does.

Each bar is what the next euro buys in that channel at the recommended spend. They land within a few thousandths of each other, around 6.27.

Continue reading →

Filed under Budget Optimization  |  Permalink
Cost per GRP vs return: why the dearest TV slots work the least

The dearest GRP works the least.

Eight TV dayparts from a €2M plan, plotted over two years. Cost per GRP on the horizontal axis, on a log scale because the prices span a factor of seventeen. What each euro gave back on the vertical. The size of each bubble is how many GRPs that slot actually buys inside the plan.

Continue reading →

Filed under Budget Optimization  |  Permalink
Budget optimisation: reallocating the same media budget for uplift

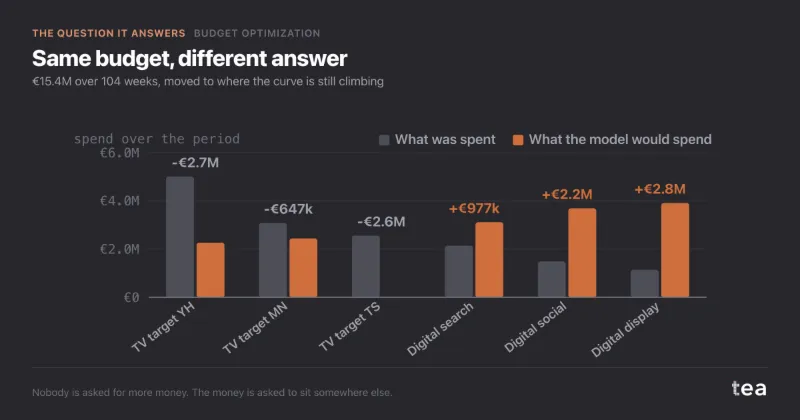
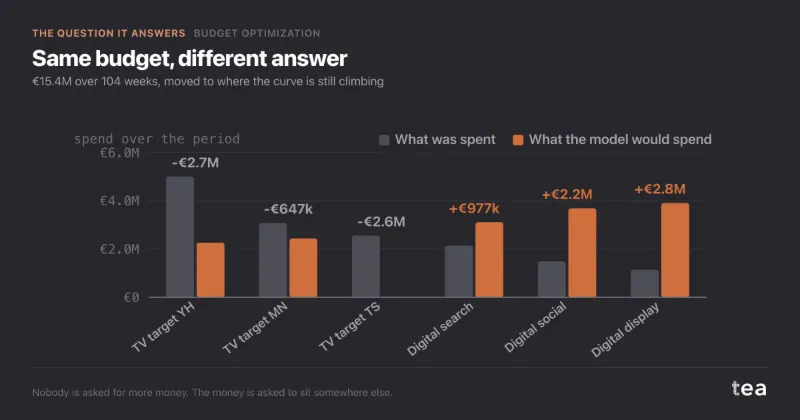
Same budget. Different answer. €15.4M over two years, and nobody is being asked for more money.

Grey is what was spent. Terracotta is what the model would spend, on the same total, given what it learned about each channel's response curve.

Continue reading →

Filed under Budget Optimization  |  Permalink