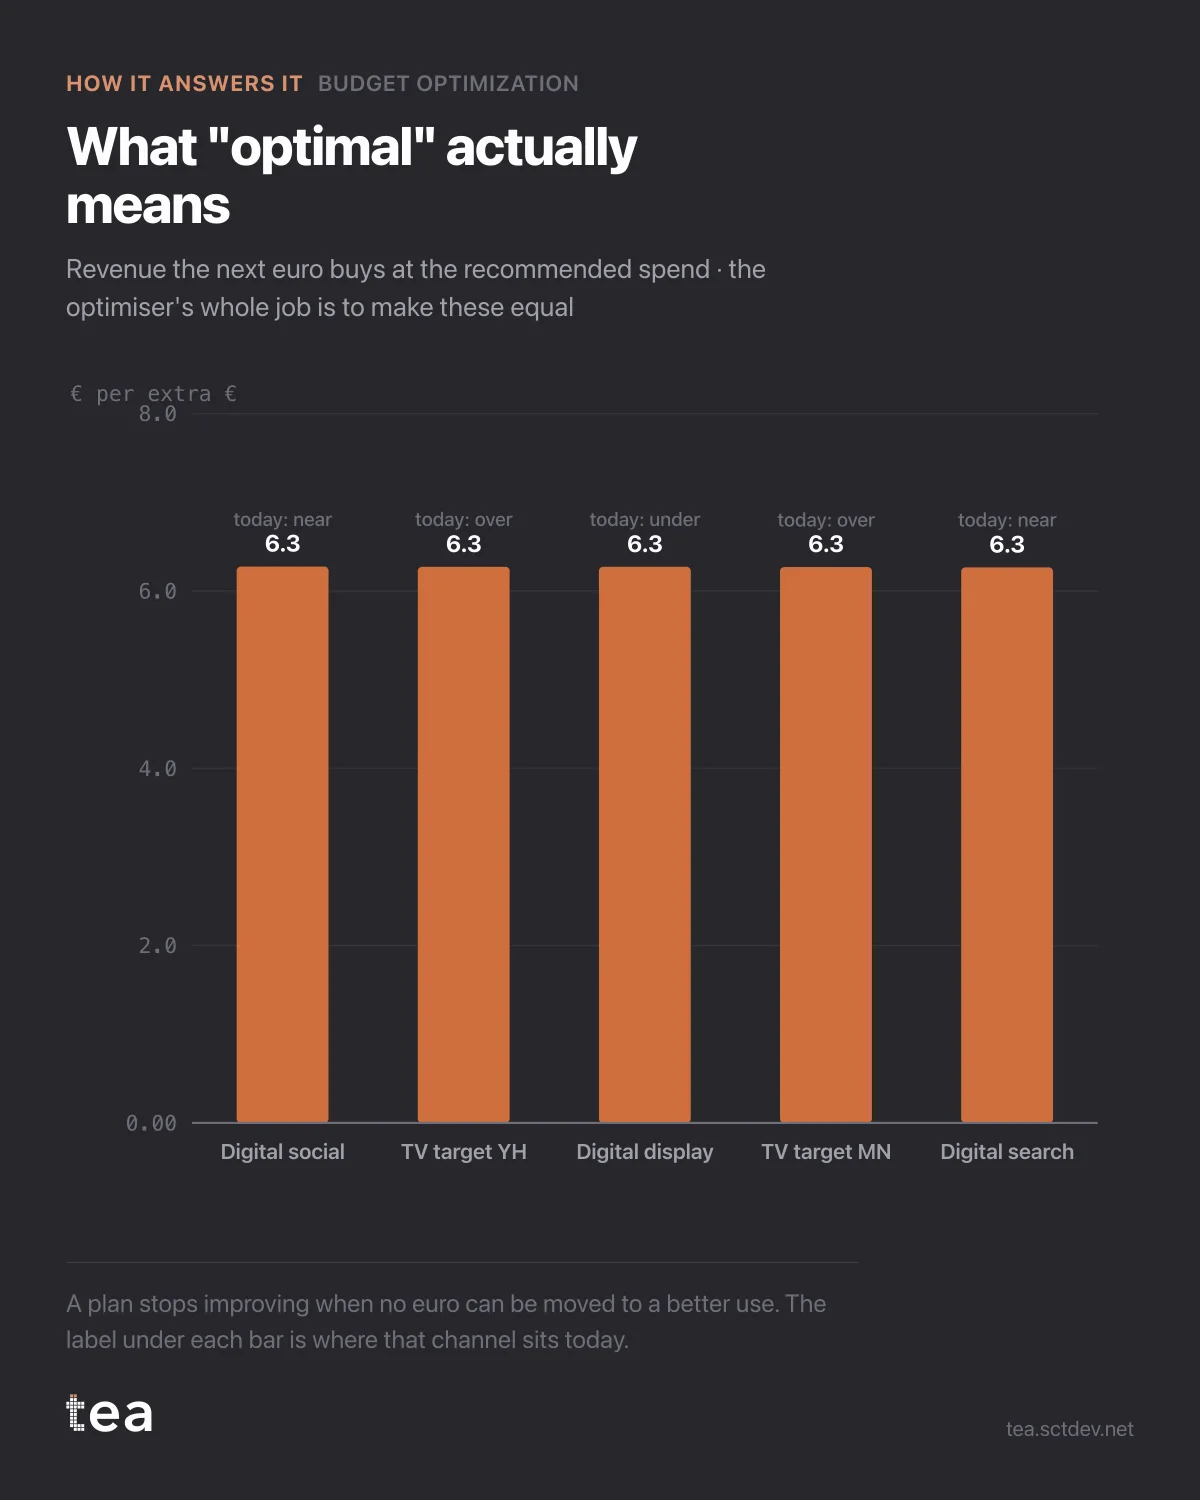
Five bars, all the same height. That is not a broken chart. That is the definition of an optimal plan, and it is the clearest thing I know for explaining what an optimiser actually does.
Each bar is what the next euro buys in that channel at the recommended spend. They land within a few thousandths of each other, around 6.27.
Here is why they have to be equal.
If one channel returned more on the next euro than another, you could move a euro from the low one to the high one and end up with more revenue on the same budget. That move is available exactly as long as the marginal returns differ. The plan stops improving when no such move exists, which means when every channel returns the same on its next euro.
That is the whole algorithm, stated without mathematics. Not "spend more on what works", which is the version everyone has heard, and which quietly overfunds saturated channels forever.
The label under each bar is where that channel sits today, and it is the interesting column. Two of them are marked over, one is near, two are under. Those verdicts are what produce the reallocation in the plan: money leaves the channels whose marginal return has fallen below the common level, and goes to the ones still above it.
Three conditions this rests on, all of them checkable.
The response curves have to be estimated jointly, or channels that ran together will trade credit and the marginal returns will be fiction.
The model has to be allowed to say no. One channel in this file is excluded because its fitted coefficient is not positive, and the note explains that correlated channels can produce that result without the channel being useless.
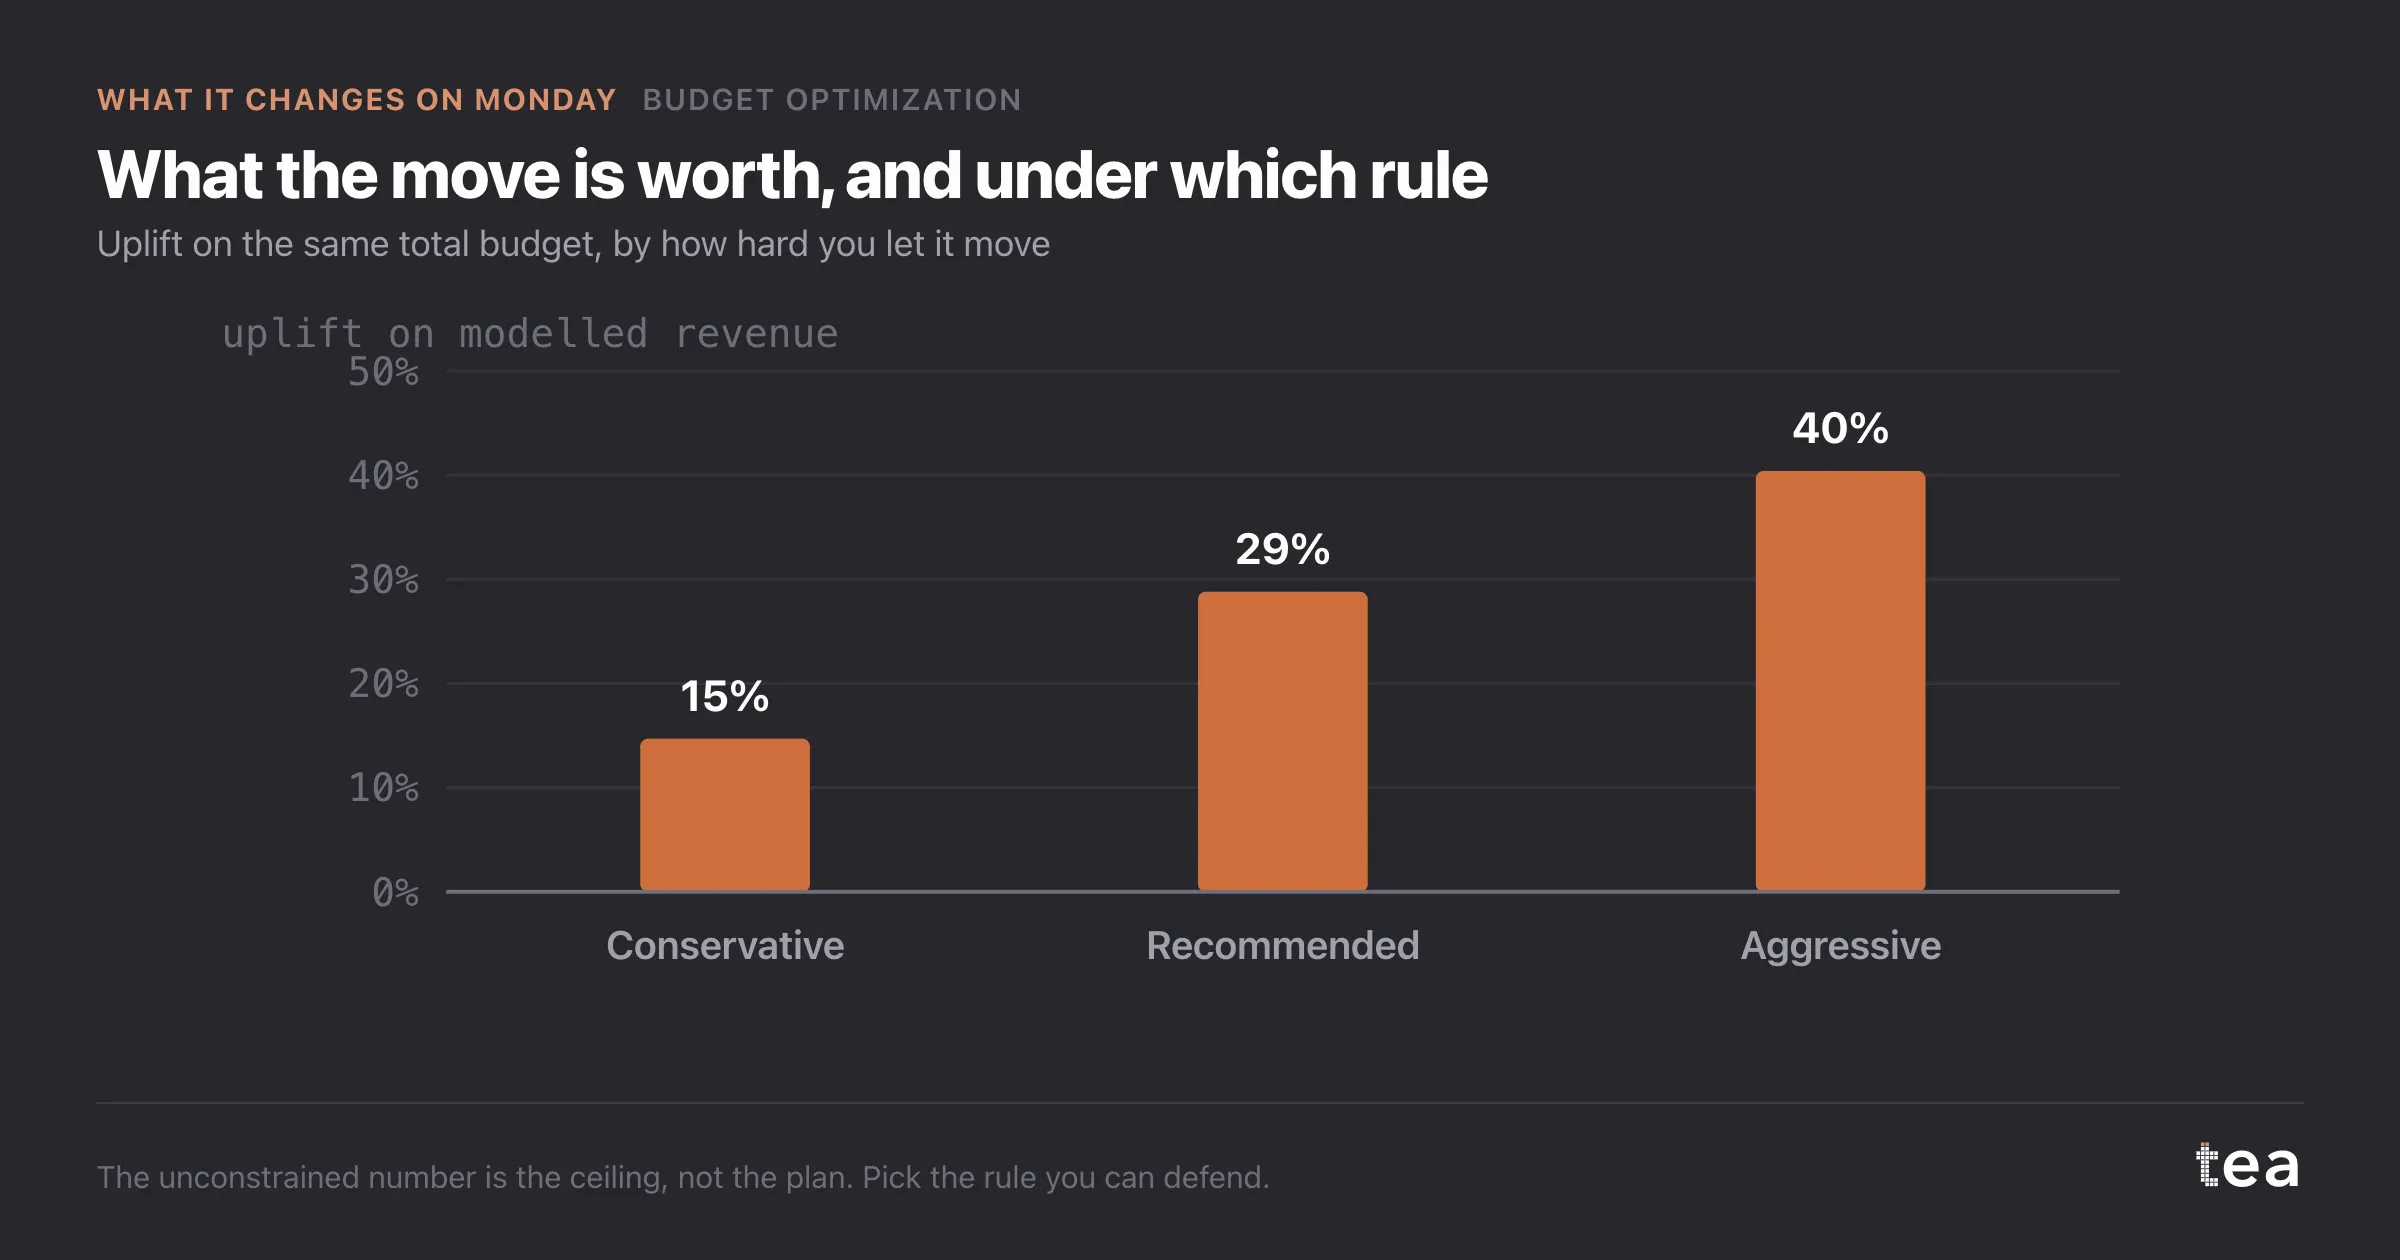
And the plan needs a constraint you can defend. The unconstrained optimum is a mathematical object. A plan that moves 70% of a TV budget in one quarter is not executable, and the conservative variant exists for that reason.
Optimal does not mean better. It means no euro can be moved to a better use, under a model you can inspect.
If you want to test whether an optimiser is any good, ask it for this chart. If the marginal returns at the recommended plan are not equal, either there is a constraint binding somewhere, which it should tell you, or it has not optimised anything.
It is also the fastest way to explain the output to someone who does not want the method. Equal marginal returns is a sentence anyone in commerce understands immediately: you keep moving money until the next euro is worth the same everywhere.
The chart is the actual output of Budget Optimization in TEA.
tea, the product
Your file, this question
Fifteen analyses on a CSV of weekly data, with the intervals and the diagnostics shown, and a plain sentence when the data cannot answer. Free while in beta, by invitation.
Request a place in the beta→tea, the product
Fifteen econometric analyses on your own CSV: Budget Optimization, saturation curves, elasticities, budget allocation. Intervals and diagnostics shown, and a plain sentence when the file cannot answer.
Free while in beta, by invitation.
Request a place in the beta →Liked this? Run it on your own data.
tea runs Budget Optimization and fourteen other analyses on any weekly CSV, in minutes. Free while in beta, by invitation.