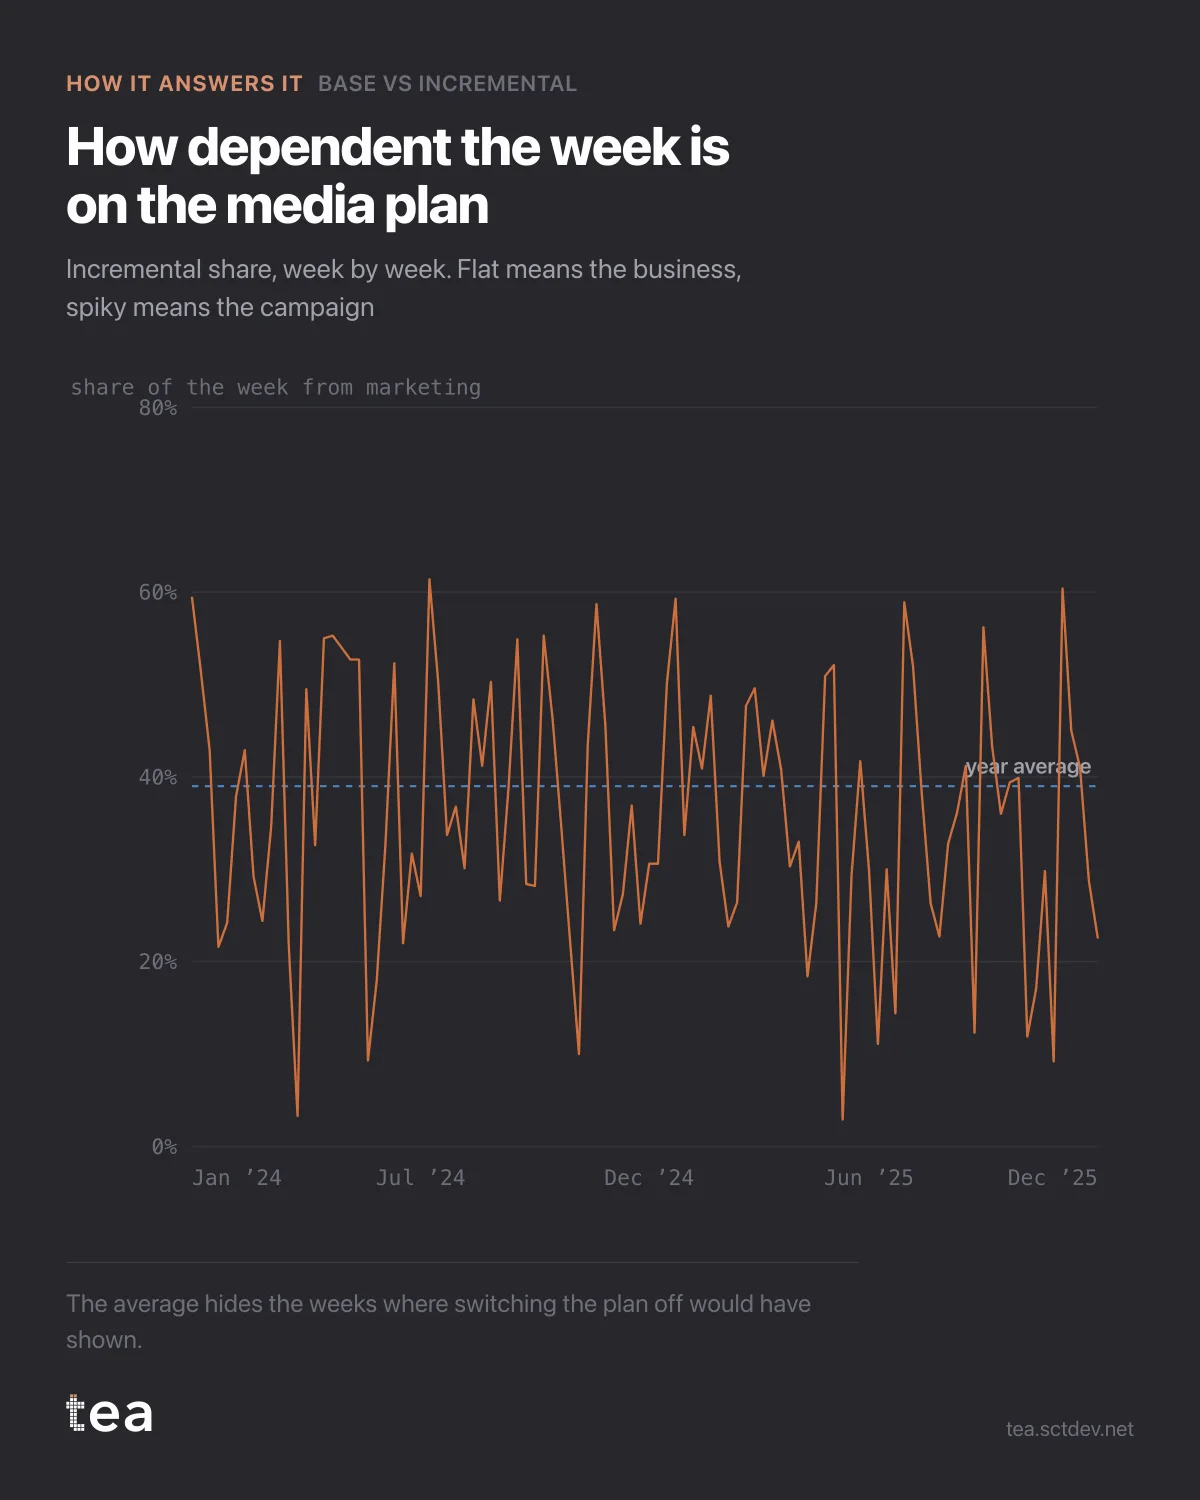
The annual number was 39% incremental. This is the same number, week by week, and it is a completely different object.
It runs from 2.9% to 61.4%.
An average that hides a twenty-fold range is not a summary, it is a smoothing. And the shape of the variation is where the operational decisions live.
What to read in it:
The floor tells you how dependent the business is. A week at 2.9% incremental is a week that would have happened with the plan switched off. If most weeks look like that, the media budget is buying peaks, not a business, and the honest description is a promotional model rather than a brand one.
The peaks tell you where the money actually worked. The largest incremental week in this file is 24 November 2025, at €272k. That is a specific week with a specific plan behind it, and it is the one to reconstruct before the next planning round.
And the flat stretches are a warning about measurement, not just about media. Long periods of low incremental share with steady spend usually mean the model cannot separate the media from the base, because the spend never varied enough to be distinguishable.
The method underneath has one property worth stating plainly. The base is a counterfactual, not an observation. Nobody switched the media off for two years to see what happened, so the band is an estimate from a fitted model, and it inherits everything that model got right or wrong. Drivers left out of the model do not vanish, they get absorbed, usually into the base.
That is why this analysis should be read with the decomposition next to it. If the coefficients behind the media drivers are weak or the intervals are wide, the split between the two bands is soft, whatever the annual percentage says.
Used properly, it is the most honest ROI conversation available without a holdout test. Used carelessly, it is a confident number with a model shaped hole in it.
One practical use for the weekly line that has nothing to do with reporting. Take the five highest weeks and the five lowest, and look at what was in market in each. That comparison is usually more instructive than the annual average, and it costs nothing beyond the chart you already have.
The other use is as an early warning. When the incremental share trends down over months while spend holds, either the market is getting harder or the plan is getting stale. Both are worth knowing in month three rather than at the annual review.
The chart is the actual output of Base vs Incremental in TEA.
tea, the product
Your file, this question
Fifteen analyses on a CSV of weekly data, with the intervals and the diagnostics shown, and a plain sentence when the data cannot answer. Free while in beta, by invitation.
Request a place in the beta→tea, the product
Fifteen econometric analyses on your own CSV: Base vs Incremental, saturation curves, elasticities, budget allocation. Intervals and diagnostics shown, and a plain sentence when the file cannot answer.
Free while in beta, by invitation.
Request a place in the beta →Liked this? Run it on your own data.
tea runs Base vs Incremental and fourteen other analyses on any weekly CSV, in minutes. Free while in beta, by invitation.