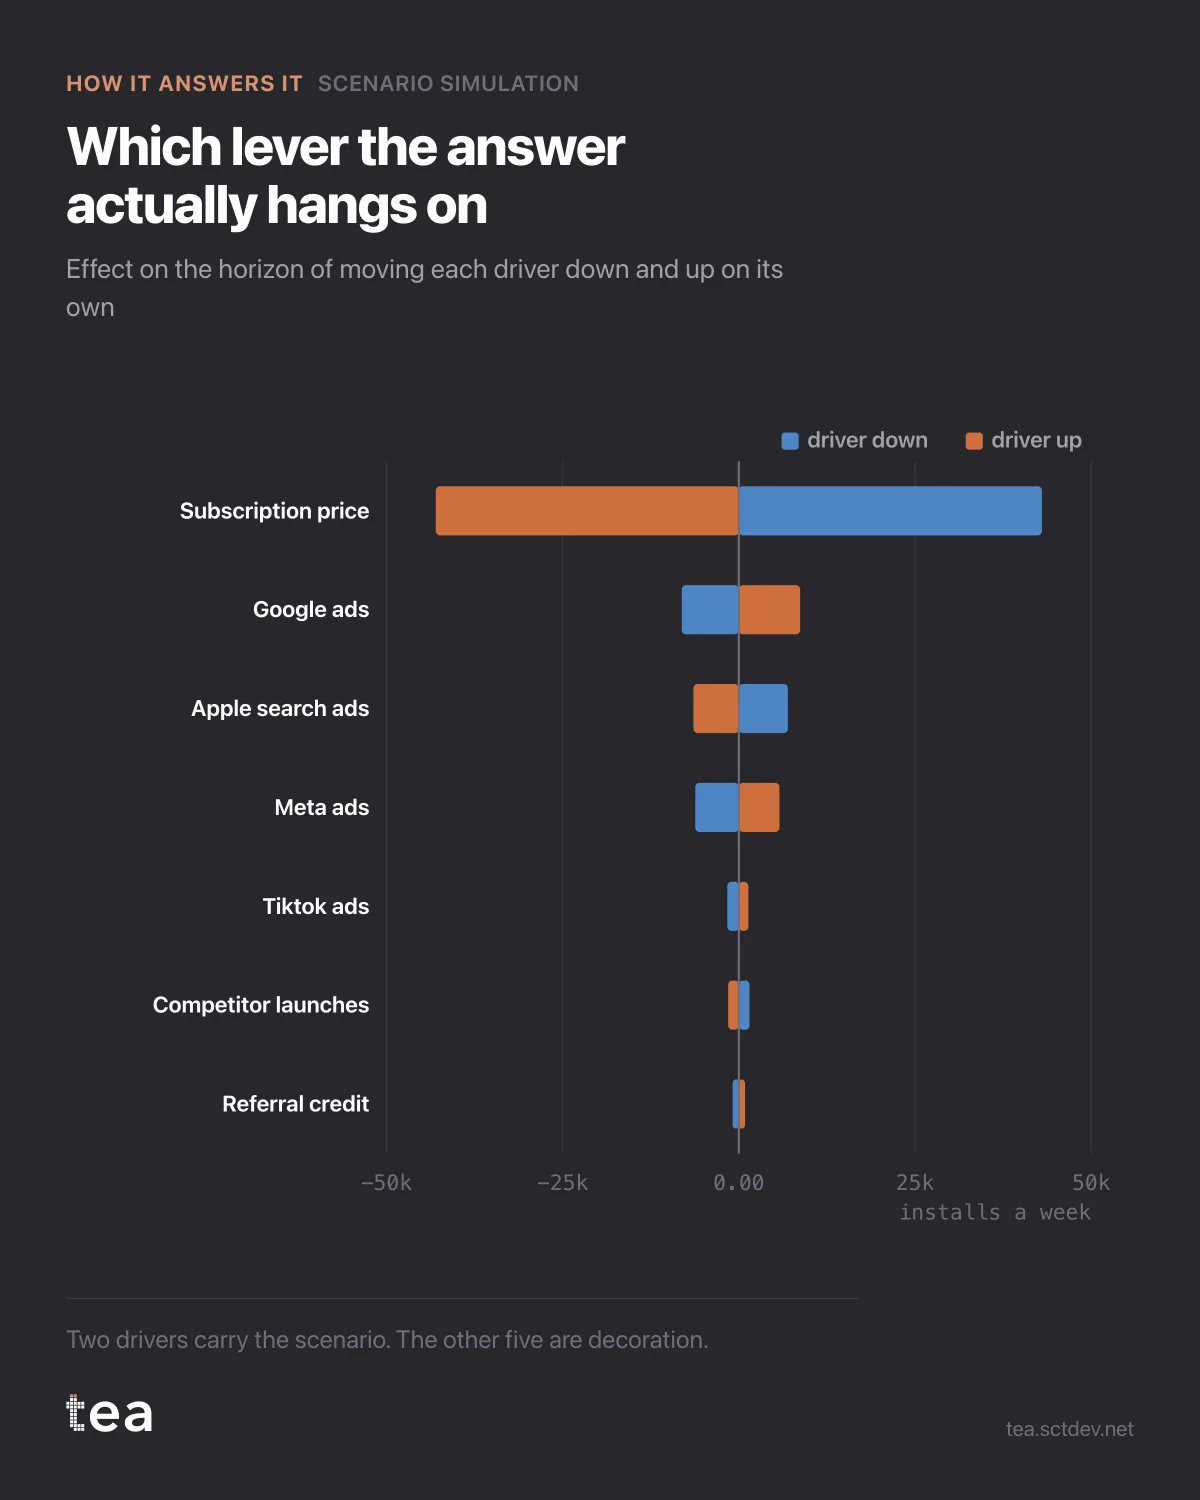
Before running scenarios, run this. It is a tornado chart, and it tells you which levers the answer actually depends on.
Each row is a driver moved down and up on its own, with everything else held. The bar is what that does to the horizon.
Subscription price: about 43,000 installs a week in either direction. Google ads: roughly 8,000. Apple search ads: 7,000. Meta: 6,000. TikTok: 1,600. The rest are rounding.
The price lever is five times the size of the largest media lever, and it is not a media decision at all.
That ordering changes what the planning conversation should be about. A team can spend a month optimising the split between Google and Meta, which is worth a few thousand installs a week at the extremes, while a pricing decision taken in another building moves forty three thousand.
Three ways to use a sensitivity chart properly.
Decide where to spend your attention. The top two rows are where modelling effort and data quality matter. The bottom rows can be left approximate without changing any decision.
Decide what to check twice. A driver with a huge lever and a weak coefficient is the most dangerous object in the model, because the whole scenario rests on a number nobody has interrogated.
And decide what to leave out. Drivers whose bars are invisible at this scale can be held constant in the scenario without loss, which makes the simulation simpler to explain and no less accurate.
One note from this particular run, and TEA prints it with the result: Apple search ads has a fitted effect that is not positive, so in this model spending more there lowers the KPI. With correlated channels that usually means the model cannot separate them, not that the channel does harm. A tornado bar for a driver in that state is a measurement of the model's confusion, and it should be read as such rather than as an instruction.
If the biggest lever in your tornado is not a marketing variable, that is a finding to take upstairs rather than an embarrassment. It is the strongest available argument for marketing being in the room when pricing is decided, and it is made with the company's own numbers.
The chart also gives you a defensible way to say no. When someone asks for a scenario on a driver whose bar is invisible, the answer is not that it is uninteresting. The answer is that the model cannot detect a difference at that scale, and here is the chart that shows why.
The chart is the actual output of Scenario Simulation in TEA.
tea, the product
Your file, this question
Fifteen analyses on a CSV of weekly data, with the intervals and the diagnostics shown, and a plain sentence when the data cannot answer. Free while in beta, by invitation.
Request a place in the beta→tea, the product
Fifteen econometric analyses on your own CSV: Scenario Simulation, saturation curves, elasticities, budget allocation. Intervals and diagnostics shown, and a plain sentence when the file cannot answer.
Free while in beta, by invitation.
Request a place in the beta →Liked this? Run it on your own data.
tea runs Scenario Simulation and fourteen other analyses on any weekly CSV, in minutes. Free while in beta, by invitation.