Archive for the category

Price Elasticity

How demand answers a price move, measured with its band: when a rise pays, when a cut does, and when the file holds no price variation to learn from.

A step of the Pricing & Promo Path.

Price elasticity of -1.4 and why a 5% price rise still paid
Household-goods maker, one washing-up liquid SKU in Italian grocery, asking whether a 5% list-price rise would cost volume.

A composite case, built from the kind of file we see most weeks. A mid-sized household-goods maker, and its biggest line: a one-litre washing-up liquid sold through Italian grocery, about 42,000 bottles a week at €3.49 on the shelf. Around €7.6M of revenue a year from one SKU, so every decimal on its price is a meeting.

Continue reading →

Filed under Price Elasticity  |  Pricing & Promo Path  |  Permalink
Price elasticity of demand: what a 1% price rise really costs

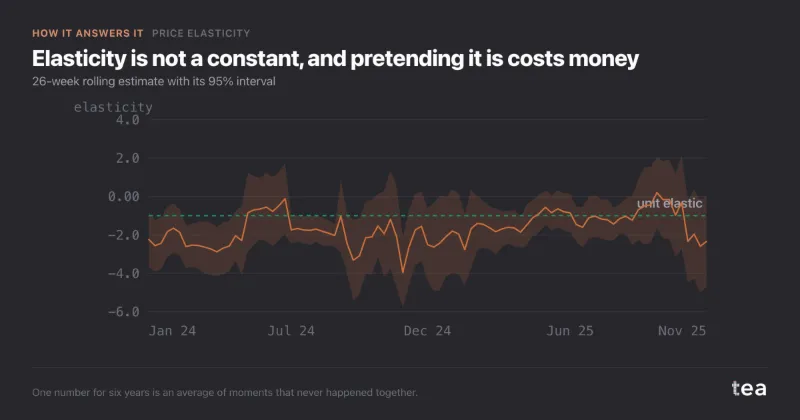
Six years of price against volume for a grocery product. Every grey dot is a week. The line is what the model thinks the relationship is.

The elasticity is -1.52, with a 95% interval from -1.85 to -1.18.

Continue reading →

Filed under Price Elasticity  |  Permalink

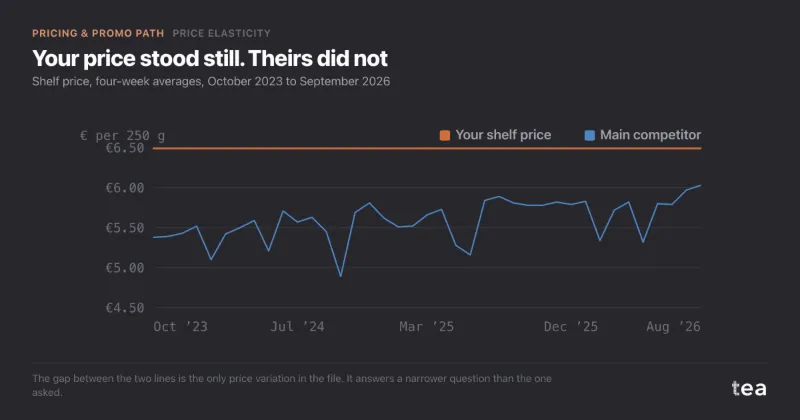
Price elasticity when your shelf price never moved in three years

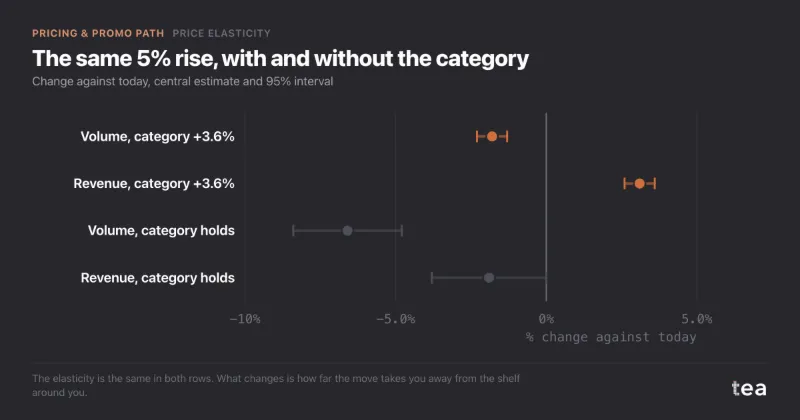
Premium coffee brand, ground coffee in Italian and Austrian grocery, asking what a move from €6.49 to €6.99 would cost in volume.

A composite case, built from the kind of file we see most weeks. A premium coffee roaster selling 250 g bags of ground coffee through grocery in northern Italy and Austria, about 12,000 bags a week, at one shelf price: €6.49. Coffee costs had gone up twice in eighteen months and the finance director wanted to know whether the brand could take the price to €6.99.

Continue reading →

Filed under Price Elasticity  |  Pricing & Promo Path  |  Permalink