UK iced coffee brand, 130 weeks of units, asked whether a summer sales spike justifies tripling a new influencer programme.
A composite case, built from the kind of file we see most weeks. A UK brand of ready-to-drink iced coffee, sold through grocery and convenience, around £14M at retail.
In the week of 16 June 2025 the brand launched its first creator programme: twenty food and lifestyle accounts, about £40,000 for the summer. Over the next six weeks unit sales ran 34% above the level of the spring. The brand manager wrote: "The spike started the week the creators went live. Can we triple the programme for next summer?"
The timing was real. The conclusion did not follow from it.
What the file looked like
130 weekly rows, from early 2023 to mid 2025. Units sold, average shelf price, weighted distribution, the creator programme's weekly fee, the number of posts, and one column that is not marketing at all: the average daily maximum temperature across the main sales regions, taken from public weather records.
Two things happened in the same six weeks as the creators. The largest grocery customer ran the product on promotion, from £2.10 to £1.85, a 12% cut, from 23 June to 3 August. And the UK had one of its hotter early summers, with several weeks above 27°C.
Three candidate causes, one spike, and they all started within a week of each other.
What the decomposition did
Contribution & Driver Decomposition fits one regression with all the drivers in it, and then hands each driver its share of every week.
The mechanics, in the order of the Discovery Path. The trend was held fixed from the first step. The calendar, including the usual summer lift, came from the seasonality step, so that "it is July" was not credited to anyone. Price went in as an elasticity: across 130 weeks, with several earlier promotions, demand answered price at about -1.3. Temperature went in with a threshold, because iced coffee does not care whether it is 9°C or 14°C, and cares a great deal about 22°C against 28°C. The creator fee went in with adstock, so that a post keeps working for a few days after it goes up.
Because earlier summers had heat without promotions, and earlier promotions ran in cooler weeks, the model had the variation it needed to tell the three apart. This is the opposite of the TV and search case: here the drivers had moved independently often enough in the past.
What built the spike
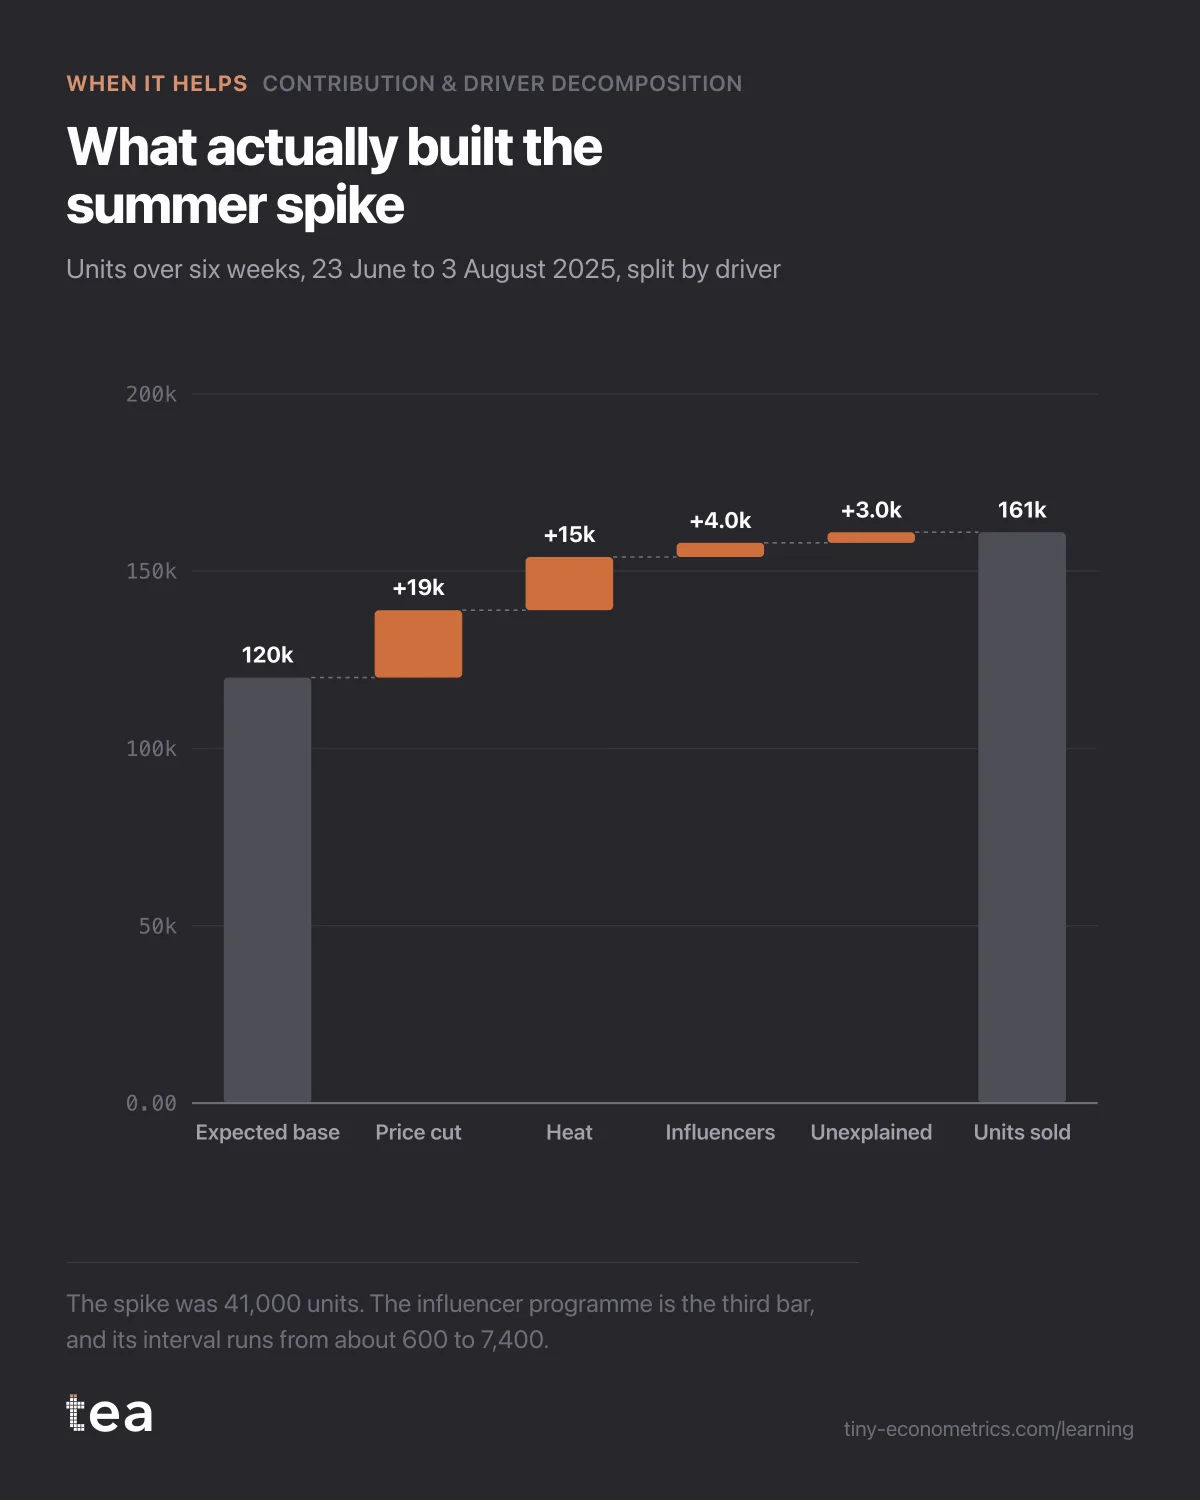
Over the six weeks the model expected about 120,000 units from base demand and the normal summer. The brand sold 161,000. The extra 41,000 split like this:
- the price cut, 19,000 units, about 46% of the spike;
- the heat, 15,000 units, about 37%;
- the creator programme, 4,000 units, about 10%, with a 95% interval from roughly 600 to 7,400;
- unexplained, 3,000 units.
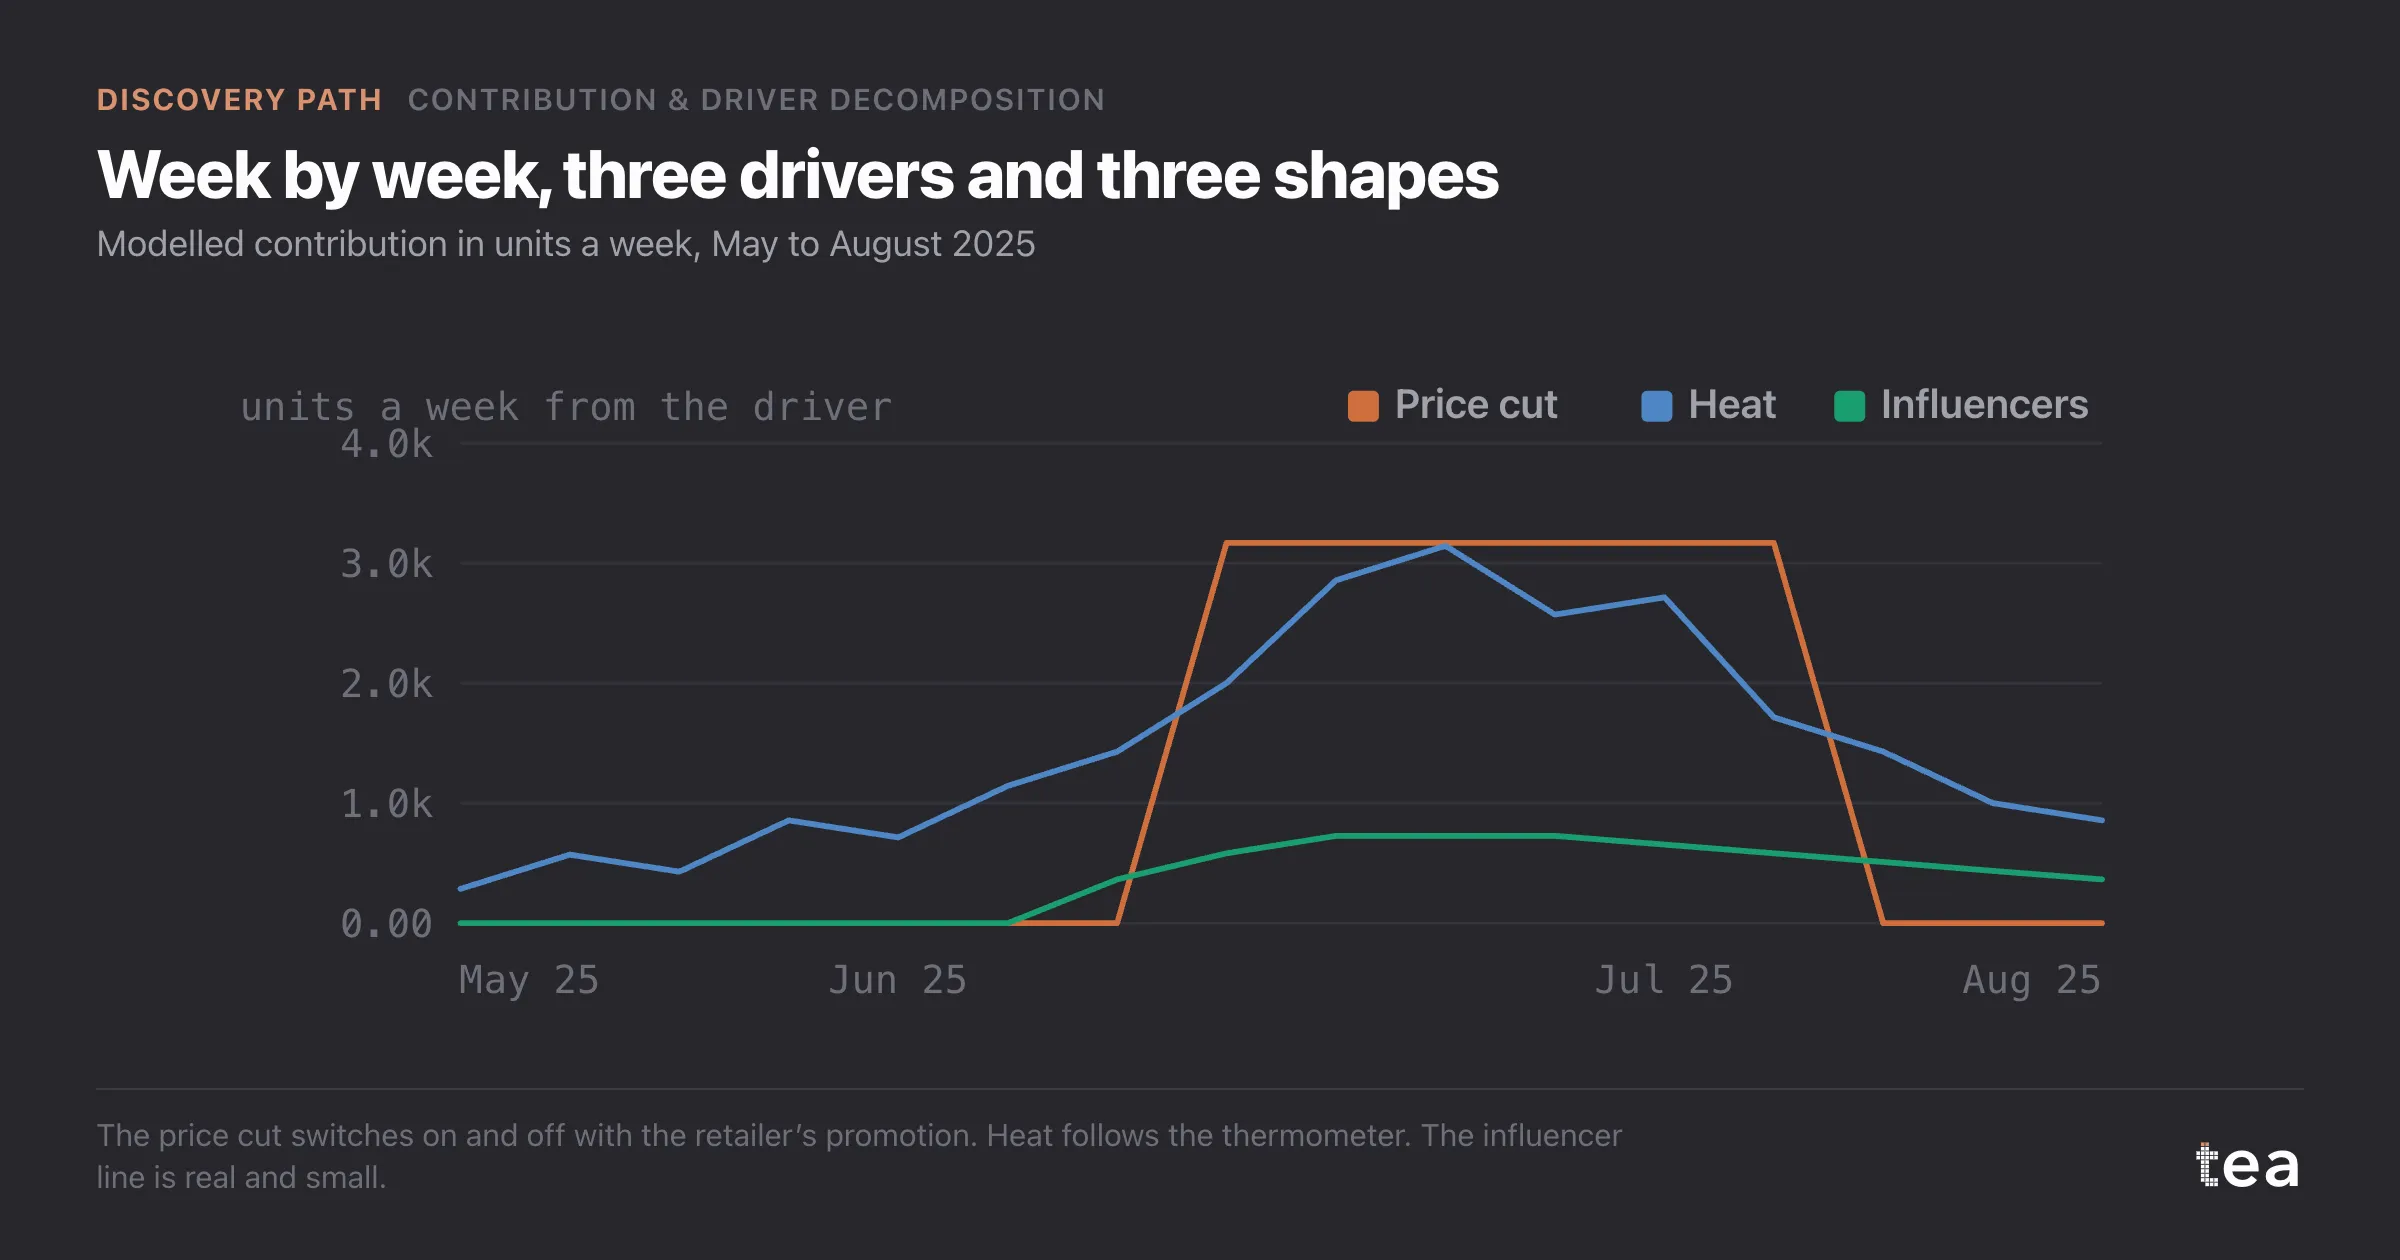
Week by week the shapes make the story plain. The price contribution is a block: it switches on in the first promotion week, holds at about 3,200 units a week, and switches off when the promotion ends. The heat contribution is a hump that follows the thermometer, peaking in mid July. The creator line rises gently in the launch week, settles around 700 units a week, and fades slowly after the programme ended.
The creators did something. It was the smallest of the three things.
The decision it changed
At £2.10 a bottle, 4,000 units is about £8,400 of retail revenue for £40,000 of fees, even at the top of the interval about £15,500. Tripling the programme to £120,000 on the strength of the spike would have bought, at the measured rate, around 12,000 more units, if the effect scales at all.
The tripling was dropped. The programme was renewed at the same £40,000, explicitly as brand-building with a different measure of success, and the summer stock plan for 2026 was rebuilt around the two drivers that actually move units: the promotion calendar agreed with the retailer, and the weather forecast.
The honest caveat went into the same memo. 130 weeks of units measure what creators do to sales inside a few weeks. If their real effect is slower, on awareness or on who tries the brand next year, this file cannot see it, and a decomposition should not pretend to.
The lesson
When a spike lines up with something you launched, list everything else that started that week before you celebrate. Price, weather and the retailer's leaflet are not marketing, and they are usually the biggest bars in the chart.
tea, the product
Your file, this question
Fifteen analyses on a CSV of weekly data, with the intervals and the diagnostics shown, and a plain sentence when the data cannot answer. Free while in beta, by invitation.
Request a place in the beta→tea, the product
Fifteen econometric analyses on your own CSV: Contribution & Driver Decomposition, saturation curves, elasticities, budget allocation. Intervals and diagnostics shown, and a plain sentence when the file cannot answer.
Free while in beta, by invitation.
Request a place in the beta →Liked this? Run it on your own data.
tea runs Contribution & Driver Decomposition and fourteen other analyses on any weekly CSV, in minutes. Free while in beta, by invitation.
The Discovery Story
- Trend analysis with a structural break, and why one line lies
- Subscription growth from marketing, or a slope already there
- Easter, year-on-year comparisons and the quarter that did not fall
- When TV and branded search collinearity defeats the regression
- A sales spike credited to influencers, decomposed by driver
- What would revenue be with zero marketing? The counterfactual year (out October 22, 2026)
- Base vs incremental after a launch, with no base in the data (out October 27, 2026)