Archive for the category

Base vs Incremental

The split a board asks for: the year you would have had anyway, and what marketing added on top of it. How to read it, and where it misleads.

A step of the Discovery Story.

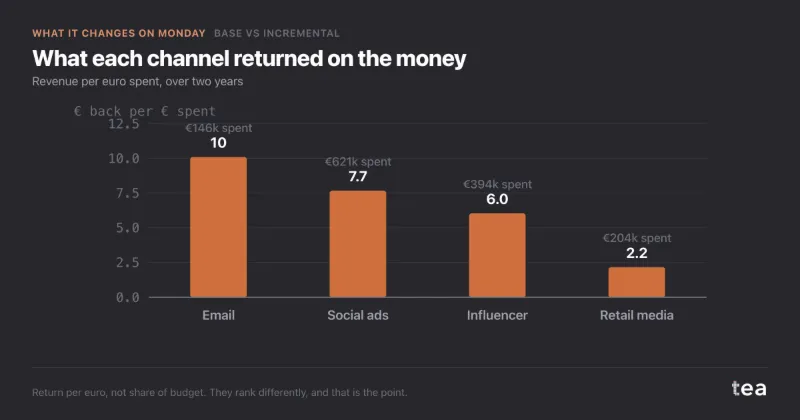
Incremental return per euro by channel, and how not to misuse it
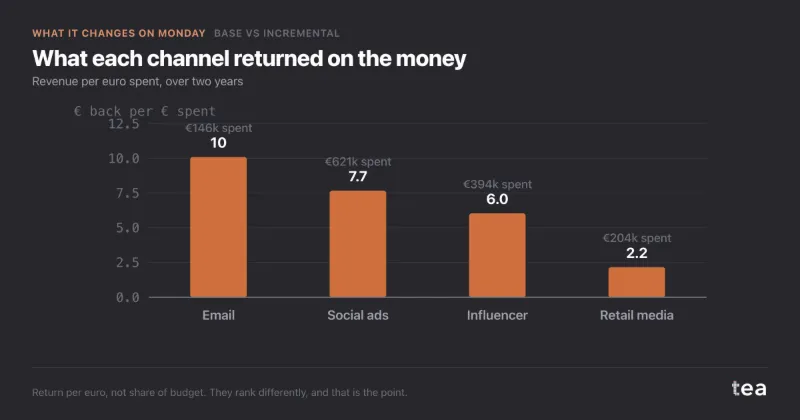
Four channels, ranked by what each euro brought back. Not by spend, not by share of budget, and the ranking is not the one the budget is in.

Email returns €10.10 per euro on €146k of spend. Social ads return €7.68 on €621k. Influencer €6.04 on €394k. Retail media €2.17 on €204k.

Continue reading →

Filed under Base vs Incremental  |  Permalink
Base demand vs marketing lift: the year you would have had anyway

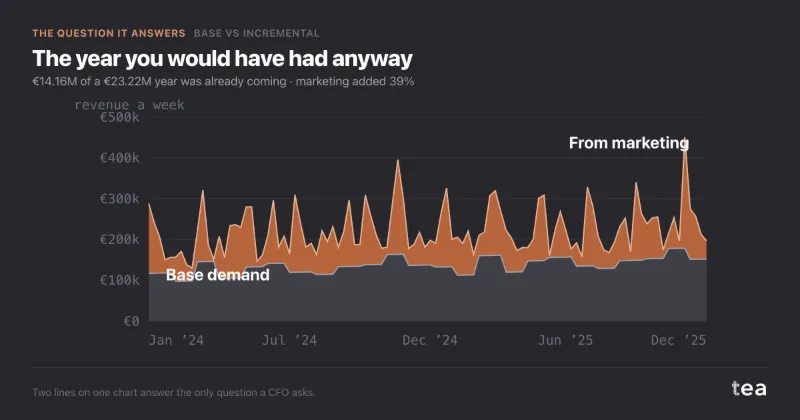
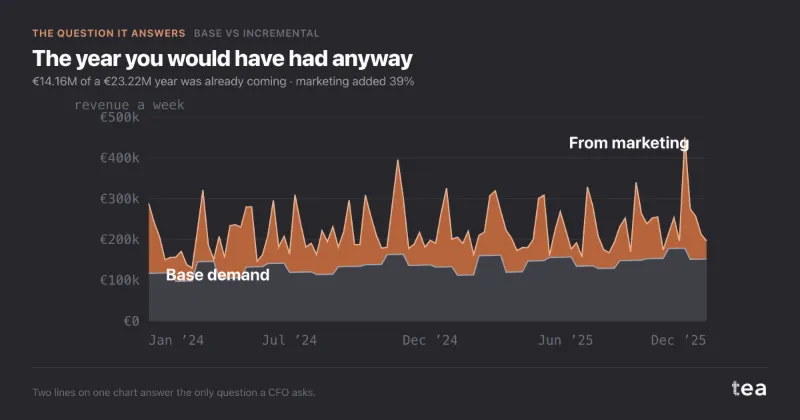
The year you would have had anyway.

Two bands, fifty-two weeks. The lower one is demand with the marketing budget at zero. Everything above it is what the campaigns added: €22.33M of a €119.18M year, 19% of it, week by week.

Continue reading →

Filed under Base vs Incremental  |  Permalink
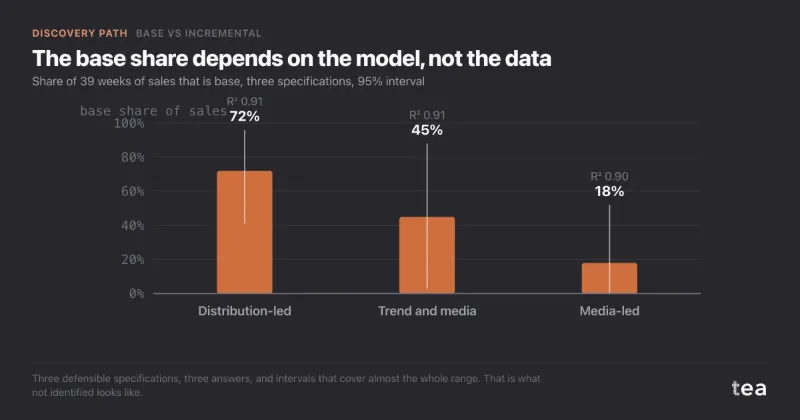
Base vs incremental after a launch, with no base in the data

German plant-based protein drink, 39 weeks since launch, media every week, the board asked how much would sell without advertising.

A composite case, built from the kind of file we see most weeks. A plant-based protein drink launched in Germany on 5 January 2026, sold through grocery and drugstores, with a launch budget that ran from the first week.

Continue reading →

Filed under Base vs Incremental  |  Discovery Story  |  Permalink

Measuring incremental revenue in the meeting instead of next week

"Can you show me what the TV actually did?"

"We'll pull the data and come back to you next week."

Continue reading →

Filed under Base vs Incremental  |  Permalink
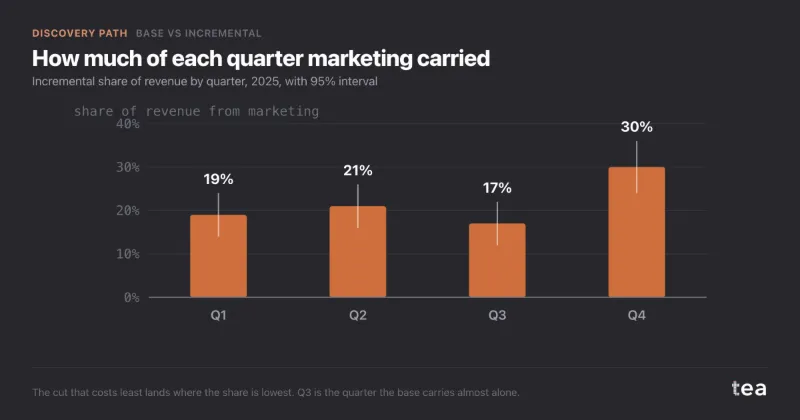
What would revenue be with zero marketing? The counterfactual year

Nordic outdoor apparel retailer, €38M online revenue, 156 weeks of data, the CFO asked what last year would have been without marketing.

A composite case, built from the kind of file we see most weeks. An outdoor apparel retailer selling online in Sweden, Norway and Finland, €38.0M of revenue in 2025 and €3.1M of marketing behind it.

Continue reading →

Filed under Base vs Incremental  |  Discovery Story  |  Permalink

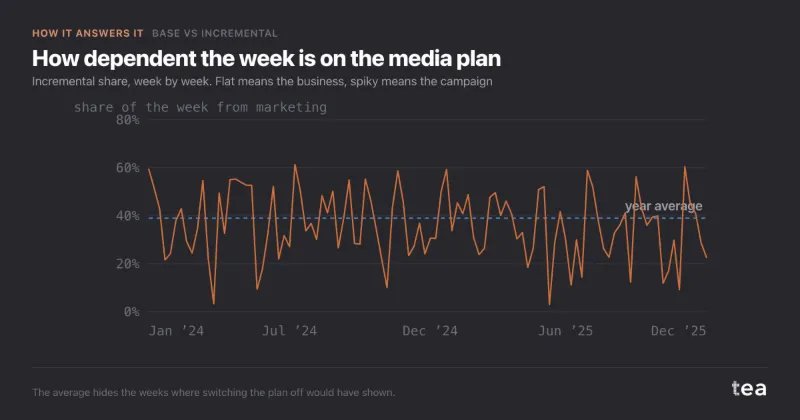
Weekly incremental share: what an annual average hides

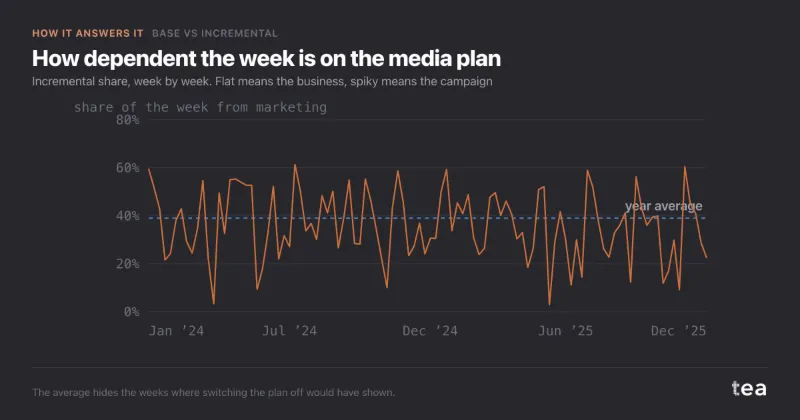
The annual number was 39% incremental. This is the same number, week by week, and it is a completely different object.

It runs from 2.9% to 61.4%.

Continue reading →

Filed under Base vs Incremental  |  Permalink
Base vs incremental sales: what marketing really added in a year

Two years of revenue at a merchandising business, split into two bands.

The lower one is what the business would have done with the media budget at zero. The upper one is what the campaigns added.

Continue reading →

Filed under Base vs Incremental  |  Permalink
How much did marketing add? Splitting a year into base and lift

"How much of the year did marketing actually add?"

It is the question every client asks once a year, usually in the last ten minutes of a meeting about something else. And the honest answer, in most agencies, takes six weeks and a specialist supplier.

Continue reading →

Filed under Base vs Incremental  |  Permalink