Thread · Media Effectiveness Story

The media ran. Did it work, and where does the next euro go?

From how long a burst keeps working to where the money should sit next quarter. This is the data story that ends in a reallocation, not in a report. The path runs Lag & Carryover, Saturation Curves, Contribution & Driver Decomposition, Budget Optimization, Geo / Segment MMM.

Here, one case per post, in reading order: where each step changed a decision, and where the file could not answer.

Adstock and the outdoor burst that was judged on the wrong week
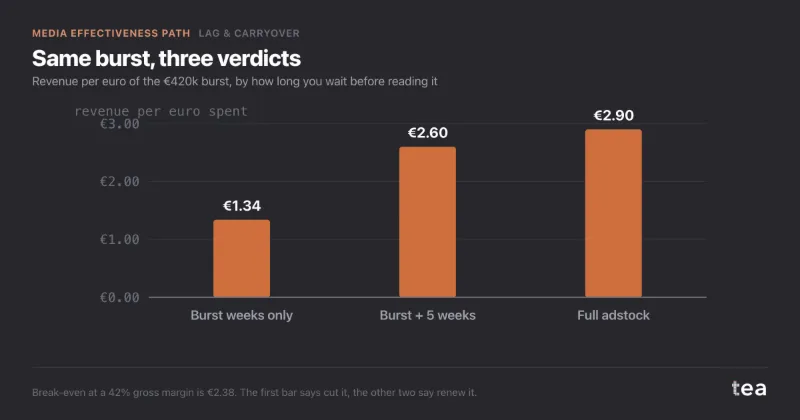
Home-furnishing retailer, 38 stores in northern Italy, asking whether a spring outdoor and radio burst had failed.

A composite case, built from the kind of file we see most weeks. A home-furnishing retailer with 38 stores across northern Italy, roughly €1.9M of revenue in an ordinary week, and a marketing team that had just been told its spring burst did not work.

Continue reading →

Filed under Lag & Carryover  |  Media Effectiveness Story  |  Permalink
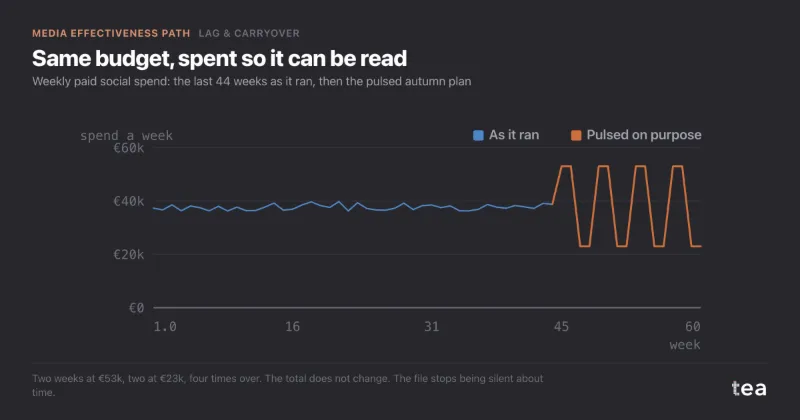
Why flat always-on spend makes carryover impossible to measure

Online home-insurance broker in Spain, always-on paid social at about €38k a week, asking what an August pause would cost.

A composite case, built from the kind of file we see most weeks. An online home-insurance broker in Spain, selling direct, with paid social as its largest channel. Spend had sat at about €38k a week for seventy weeks. Leads, meaning quote requests, ran at around 4,200 a week.

Continue reading →

Filed under Lag & Carryover  |  Media Effectiveness Story  |  Permalink
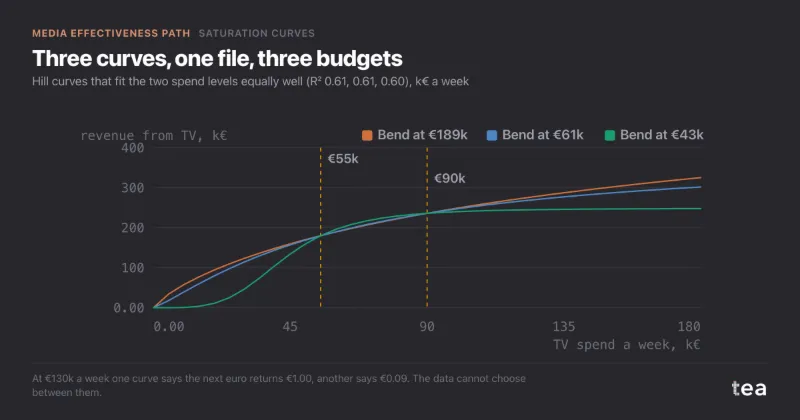
A TV saturation curve fitted on only two spend levels

Soft-drinks producer in Portugal, TV at €55k or €90k a week for two years, asking whether to go to €130k next summer.

A composite case, built from the kind of file we see most weeks. A soft-drinks producer selling through grocery in Portugal, about €1.1M of revenue in a typical week, with TV as the backbone of the plan for two years.

Continue reading →

Filed under Saturation Curves  |  Media Effectiveness Story  |  Permalink
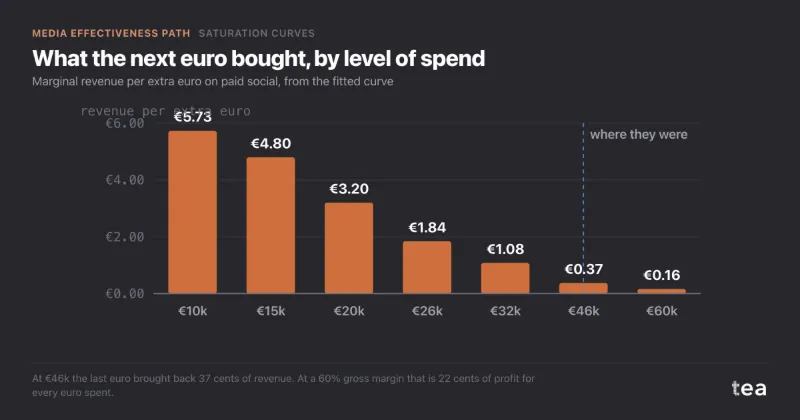
Paid social past the bend: the saturation curve behind a cheap cut

Direct-to-consumer skincare brand in Germany and Austria, paid social at €46k a week, asking why returns kept falling.

A composite case, built from the kind of file we see most weeks. A direct-to-consumer skincare brand selling online in Germany and Austria, about €480k of revenue in an ordinary week, with paid social as its largest channel.

Continue reading →

Filed under Saturation Curves  |  Media Effectiveness Story  |  Permalink
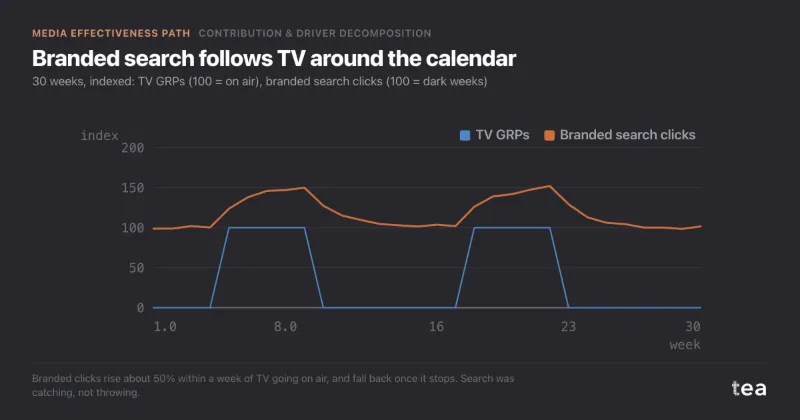
Contribution decomposition: when branded search harvests TV demand

Home and kitchen e-commerce brand in France and Belgium, €38M a year, asking whether to cut TV because last-click ranked it last.

A composite case, built from the kind of file we see most weeks. A home and kitchen brand selling online in France and Belgium, about €38M of revenue a year and €4.2M of media: €1.6M on TV, €0.9M on branded search, €0.8M on generic search and €0.9M on paid social.

Continue reading →

Filed under Contribution & Driver Decomposition  |  Media Effectiveness Story  |  Permalink
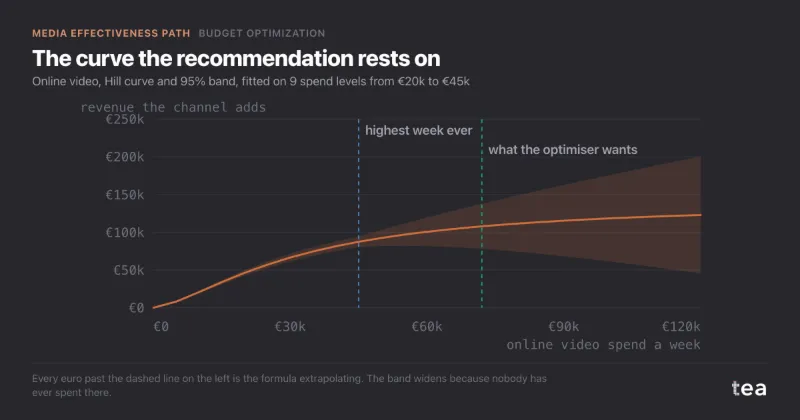
When a budget optimiser says move 60% into one channel

Consumer electronics retailer in the Netherlands, €6.2M of media a year, asking whether to follow an unconstrained reallocation.

A composite case, built from the kind of file we see most weeks. A consumer electronics retailer in the Netherlands, 60 stores and a large web shop, €6.2M of media a year: €2.2M on TV, €1.2M on online video, €0.9M on outdoor, €0.7M each on radio and paid search, €0.5M on social.

Continue reading →

Filed under Budget Optimization  |  Media Effectiveness Story  |  Permalink
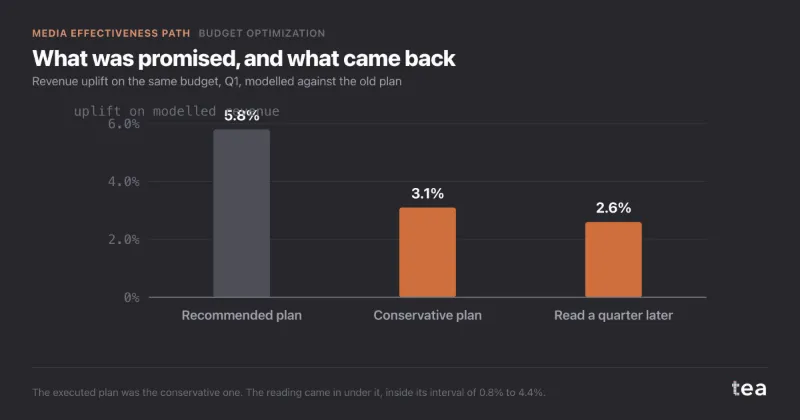
A media budget reallocation, executed and read a quarter later

Pet-food brand in Germany, €9.6M of media a year, asking whether the same budget could do more next year.

A composite case, built from the kind of file we see most weeks. A pet-food brand selling through German grocery and online, €9.6M of media a year across TV, online video, paid search, paid social and outdoor.

Continue reading →

Filed under Budget Optimization  |  Media Effectiveness Story  |  Permalink
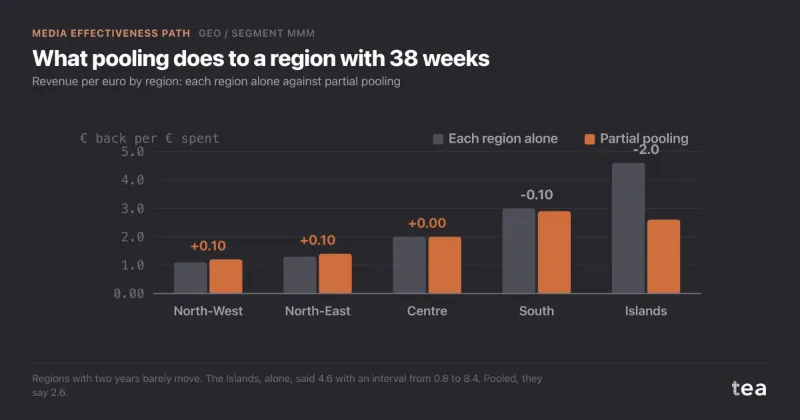
Geo MMM: the national average that hid a north and south split

Italian packaged-coffee brand, €1.8M a year of regional radio and online video, asking whether to keep splitting it by population.

A composite case, built from the kind of file we see most weeks. An Italian packaged-coffee brand sold through grocery, with national TV as the main channel and €1.8M a year of regional media on top: local radio and online video bought region by region.

Continue reading →

Filed under Geo / Segment MMM  |  Media Effectiveness Story  |  Permalink