ea

Analyses/Media Effectiveness Path/Geo / Segment MMM

Where the national average hides two markets.

Geo / Segment MMM fits the same media model in every region, sales channel or category, and lets each one borrow from the others only as far as its own data is thin. It tells you which channels really differ from place to place, and which only look different because a region is small.

Answers Does each channel work the same in every region? Needs A weekly KPI and spend per channel, by region Hands back Effect per region, spread τ, where the next euro works

One national number, five regional ones

revenue per euro of regional media, 95% interval
  • National average
  • Region, partial pooling
  • 95% interval
South against North-West2.4×€2.9 and €1.2 back per euro
Spread between regions, τ0.7 € per €against a national return of 1.9
Islands, 38 weeks2.6 pooled4.6 when fitted alone, 0.8 to 8.4

The regional radio and video of an Italian coffee brand, from the first example below. A composite case: your file draws its own regions, channel by channel, with their intervals.

01

What it is for

A national model gives every channel one number. That number is an average of markets that may not behave alike, and a budget split by population inherits it. The question here is not how well media works, but whether it works the same everywhere, and how sure the file can be about each place.

Splitting a regional budget

If radio returns twice as much in the South as in the North-West, a split by population leaves that difference unspent. The pooled estimates say where the next euro is worth more, and by how much.

Planning a small market honestly

A region with a few months of data, fitted alone, comes back with a wild number. Partial pooling gives it a defensible one and shows how much of it is borrowed from the rest of the country.

Deciding how local the plan should be

Some channels differ by region and deserve their own line. Most often the rest do not, and can be bought nationally. The spread between regions decides which is which, before the organisation chart does.

02

How to read it

The page opens on a summary of four numbers, one per question, and every chart below it expands one of them. Read them in this order, on the model the page is showing: partial pooling unless you change it.

Executive Summary
Largest region gap 2.5×1 Channels that differ 1 of 52 Movement specific to regions 27%3 Model fit 0.46 to 0.944

Channel effect by region · Radio

Do the regions really differ?

  1. The largest region gap. The channel whose effect varies most across regions, and how far apart its strongest and weakest region are. Here radio works 2.5 times as hard in Isole as in Nord. Under the pooled model it reads 1.0× by construction, because that model cannot see a difference.
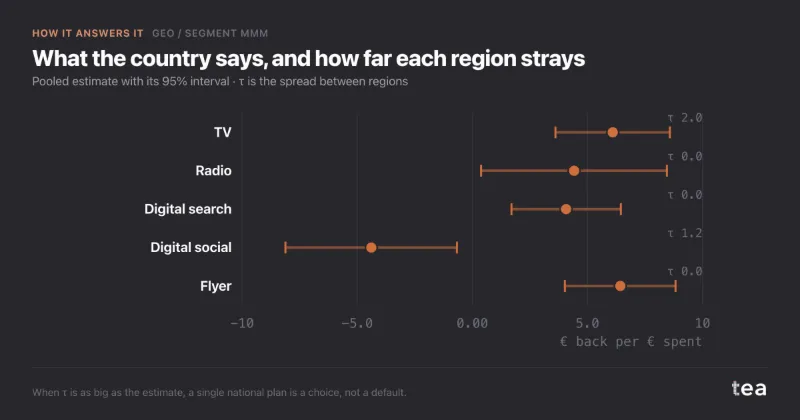
  2. The channels that differ. Channels whose spread across regions, τ, is larger than half the noise in one region’s estimate. Only these are worth planning region by region. The others share one national number, and the chart beside it shows why: the bar is τ, the dot is the noise.
  3. The movement specific to regions. The share of week-to-week movement in revenue that belongs to one region rather than to all of them, each region indexed to its own average. Below about 15% the regions move in lockstep and a geo model adds little to a national one.
  4. The fit, R². The range across regions, with the weakest one named. A low R² is not an error: it marks the region whose channel estimates lean hardest on the national ones, which is exactly what partial pooling is for.

03

Where it sits in the analysis

Geo / Segment MMM is the optional last step of the Media Effectiveness Path, because not every file carries a region column. It comes last for a reason: the national model has to be right before it can be split. Carryover and saturation are properties of the channel, shared by every region, and only the size of the effect is allowed to differ.

What it hands on is a regional reading of the same budget: which channels deserve a line per region, and where one more euro works hardest. The optimiser turns that into a split, and Scenario Simulation tests the regional plan against business as usual before it is signed.

It also answers a question the organisation usually settles by habit: how local the plan should be. When every channel comes back as one national number, that is a result too, and it saves a meeting about regional exceptions.

Media Effectiveness Path

  1. Lag & Carryover

    Finds how long a burst keeps working, before anyone tries to measure how big it was.

  2. Saturation Curves

    Where each channel stops paying back, fitted as a curve rather than asserted as a rule of thumb.

  3. Contribution & Driver Decomposition

    What each channel actually contributed across the window, adstock and saturation included.

  4. Budget Optimization

    The same budget, moved. With the conservative scenario for when the plan meets reality.

  5. Geo / Segment MMM this page

    The same model per region or segment, if your file carries one. Where the average hides two different markets.

04

Where it usually misleads

A geo model splits one file into several smaller ones, and every trap follows from that. Each region knows less than the country does, and the numbers do not say so unless they are made to.

A small region fitted alone

Thirty-eight weeks of the Islands, fitted on their own, gave 4.6 per euro with an interval from 0.8 to 8.4. Taken at face value it was the best place in the country to spend, and the next plan would have doubled it. First example below.

Partial pooling is the default model. The region estimated alone stays on the chart as a pale mark, the line shows how far pooling pulled it, and the inspector prints the weight each estimate puts on the region’s own data.

A national number planned everywhere

An average is a fair summary only when the parts agree. A national return of 1.9 that is 1.2 in one region and 2.9 in another describes no region in particular, and a split by population spends as if it did.

If you switch to the pooled model, the largest-gap tile reads 1.0× and its note warns that the gap is zero by construction, with the advice to switch back to partial pooling to see it.

Noise taken for a regional difference

Four separate regressions will always give four different numbers. Most of those differences are sampling error, and a regional plan built on them chases noise with a region’s name on it.

Each channel’s spread τ is set against the noise in a single region’s estimate. Where it is lost in the noise, the channel is labelled “One national number”.

A negative effect read as harm

A channel that comes back below zero everywhere looks like money that lowers sales. With channels booked together, it almost always means the model cannot separate them. Cutting it on that reading kills a channel by regression.

When a channel’s effect is not positive in any region, a note under the results says so, and says that with correlated channels this usually means the model cannot separate them.

A local share read as a share of revenue

The movement specific to a region is a share of variance. A region with a third of its own story can be the smallest in the business, and one that moves with the country can carry most of the revenue.

Read the split beside each region’s size: open a cell and the inspector gives the channel’s ceiling in euros a week for that region, not only as a share.

A plan beyond the spend a region has seen

A region that has never spent more than €7.5k a week on radio has no evidence about €15k. Moving budget there projects the curve into weeks the file never contained, and the projection looks as solid as the rest.

Each response curve is solid only across the weekly spend the region actually saw, and dashed beyond it, where the tooltip reads “Beyond observed spend”.

05

Two examples

One file where the regions really differed and the split moved, one where the honest answer was to wait. Both are useful results.

Helps

The national average that hid a north and south split

An Italian packaged-coffee brand spent €1.8M a year on regional radio and online video, split by population. A national model put the return at €1.9 per euro, and the plan was to split it the same way again. The file had four regions with 104 weeks each and the Islands with only 38, 454 rows in all.

Partial pooling found a spread between regions, τ, of 0.7 against that national 1.9: the South returned 2.9, the North-West 1.2. The Islands, 4.6 alone, came back to 2.6 pooled. €230k a year moved from the two northern regions to the South and Centre, within 30% per region, for about €370k more revenue a year projected, €180k in the conservative scenario. The Islands kept their population share until another 26 weeks are in.

The same €1.8M, split by return

€k a year

No new money: €230k taken from the North-West and North-East and given to the South and Centre, each region kept within 30% of what it had already seen.
Does not help

The region with its own story, and too little of it

A grocery retail file, four regions over 104 weeks and five channels. Across the business 72.8% of the weekly movement was shared nationally and 27.2% was local. Region by region the local share ran 24%, 24% and 22%, and then 35% for the Islands: three regions moving with the country, one with a third of its own story.

That was the region a national calendar would fight every week. It was also the smallest by revenue and the weakest fit, at an R² of 0.42, so the high local share could be a different market or simply a small, noisy one. The analysis could not tell which. The national plan stayed the default, the Islands became a candidate for their own line, and the decision waited for more weeks of data.

How much of each region is the country

share of weekly movement
  • Shared with the country
  • Specific to the region

The region a national plan serves worst is also the one the file knows least about. Here the two point in opposite directions.

06

What the charts add to the numbers

A table of regions by channels is twenty numbers nobody remembers. Each chart answers one planning question about them: how hard a channel works in each place, whether the places really differ, and where the next euro should go.

Response curves by region

radio, weekly contribution as % of regional revenue
  • Nord
  • Centro
  • Sud
  • Isole
  • dashed: beyond observed spend

Reads as: what one channel adds at any weekly spend, in each region, on one vertical scale. The dot is the region’s typical week, and the solid stretch is the spend it has actually seen: a plan that lands on the dashed part is a guess. It is the chart for moving money between regions.

Shared or specific to one region

share of weekly movement that is local

Reads as: how much of each region moves with the country and how much on its own. Three regions near a quarter and one at a third say the national calendar fits most of the business and fights one part of it. It is the chart for deciding how local the plan should be, read beside each region’s revenue.

Where the next euro works

revenue from one more euro of weekly spend, at each region’s typical week

Reads as: every region and channel ranked by what one more euro returns, in five shades from the lowest cell to the highest. It is the question an optimiser asks, laid out for a person: move money from the palest cells to the darkest ones first. On this sample no cell returns a full euro of revenue at its typical week, and the page says so, which makes it a chart about where to cut first rather than where to add.

tea, the product

Find out where your national number holds

A CSV with a date, a region, a KPI and the spend per channel. The effect in every region with its interval, the spread between them, and a plain sentence when the regions cannot be told apart. Free while in beta, by invitation.

Request a place in the beta

tea, the product

Fifteen econometric analyses on your own CSV: Geo / Segment MMM, saturation curves, elasticities, budget allocation. The diagnostics shown, and a plain sentence when the file cannot answer.

Free while in beta, by invitation.

Request a place in the beta →

Now run it on your own data.

tea runs Geo / Segment MMM and fourteen other analyses on any weekly CSV, in minutes. Free while in beta, by invitation.

Join the beta