UK coffee capsule brand, about £21M a year, asking how much volume a ten-week-old entrant was taking at one chain.
A composite case, built from a situation we meet every few months: a UK brand of compatible coffee capsules, about £21M a year through grocery and online, listed at four large chains. Ten weeks before the file reached us, a new value brand launched at one of the four, priced 22% below it per capsule.
The question
"How much volume is the new brand taking from us, and do we need to cut our price at that chain to stop it?"
The commercial team wanted a cross-elasticity: the number that says how much our volume moves when their price moves. It is the right number to want. It was the wrong file to ask it of.
What the file looked like
Three years of weekly data for the brand: volume and price by chain, promotions, distribution. For the entrant, ten weeks of shelf price at one chain. And in those ten weeks the entrant's price had not moved once. Launch price, every week.
A cross-elasticity is estimated from co-movement: weeks when their price was higher or lower, and what our volume did in those weeks compared with the others. With a flat price there is no co-movement to read. The price column is a constant for ten weeks and missing before, which mathematically makes it the same thing as a single switch for "the entrant is on the shelf". Cross-Elasticity said exactly that, and declined to print an elasticity.
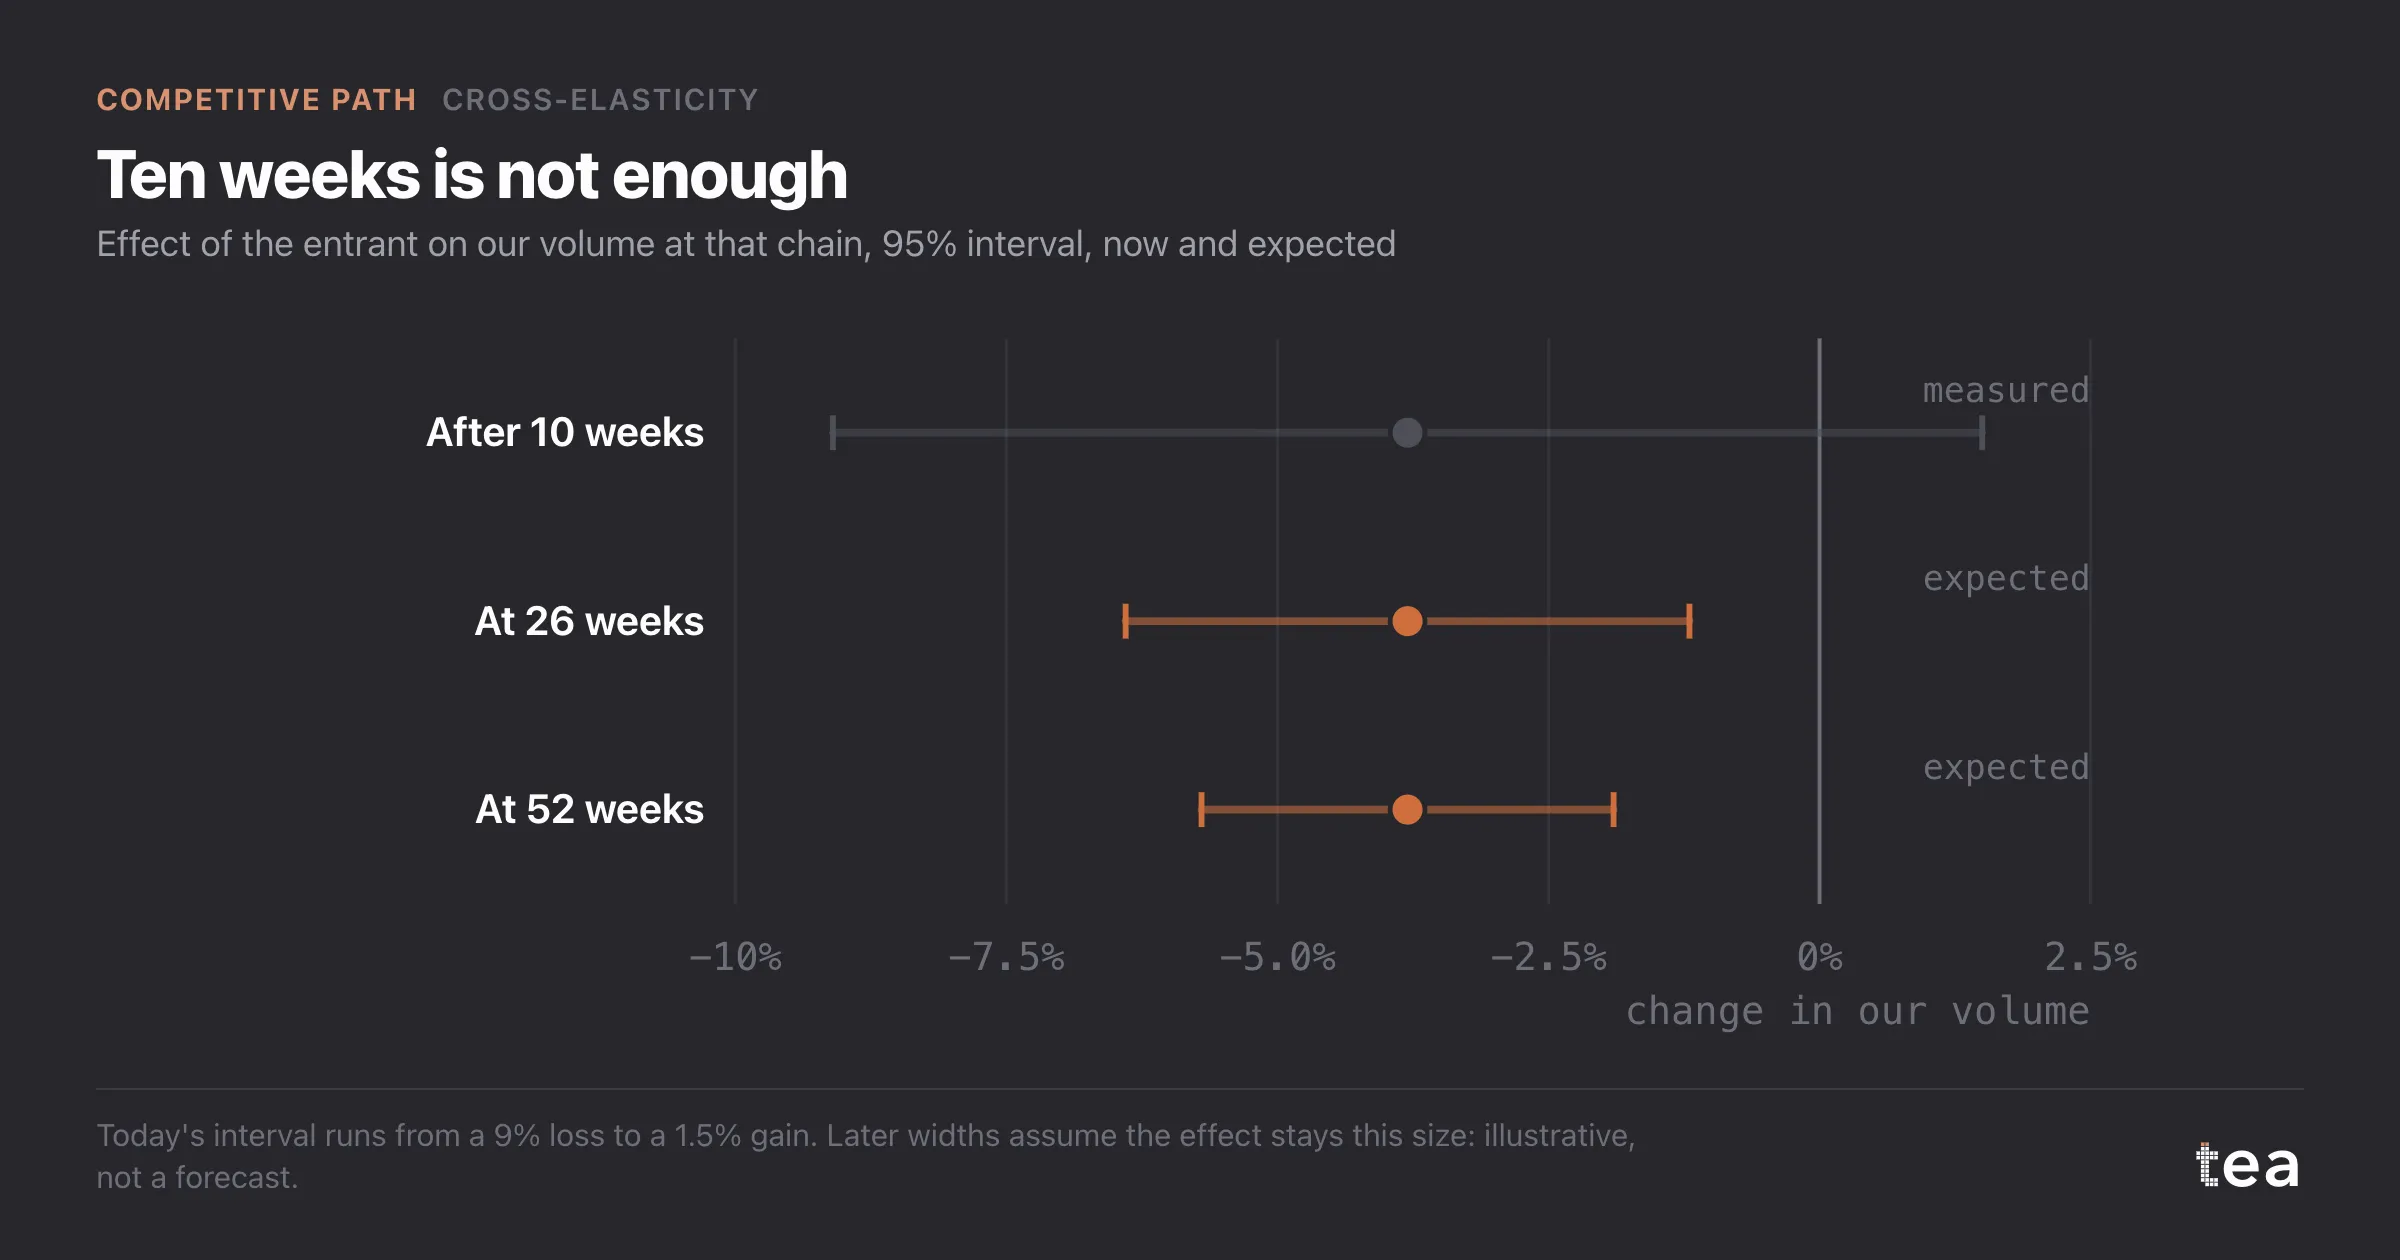
What it could estimate was the switch: the average difference in our volume at that chain in the ten weeks since launch, against what the model expected. That came out at -3.8%, with a 95% interval from -9.1% to +1.5%.
Why the number cannot carry the decision
Three things sit inside that -3.8%, and ten weeks cannot separate them.
The launch landed in the second week of January, when capsule volume always drops after Christmas gifting. The seasonal profile is estimated from three earlier Januaries and catches most of it, but no two Januaries are the same.
In the same fortnight the chain cut one of our facings in the coffee aisle to make room for the entrant. That is a distribution loss, and it shows up in volume whether or not a single shopper switched.
And then there is switching itself, which is what the question was about.
The interval runs from a loss of 9% to a gain of 1.5%. It includes zero. It also includes a loss large enough to justify a price response. A model that reports that is being honest. Had we forced an elasticity, by assuming one or borrowing one from another category, the output would have looked like a measurement and been a guess. The likely decision on the back of it, a 10% price cut at that chain, would at the brand's own price elasticity of -1.4 have added about 14% volume and cost about 11% of gross margin there, indefinitely, against a threat of unknown size.
What to watch instead
There was useful evidence in the file. It just was not an elasticity. We suggested four things.
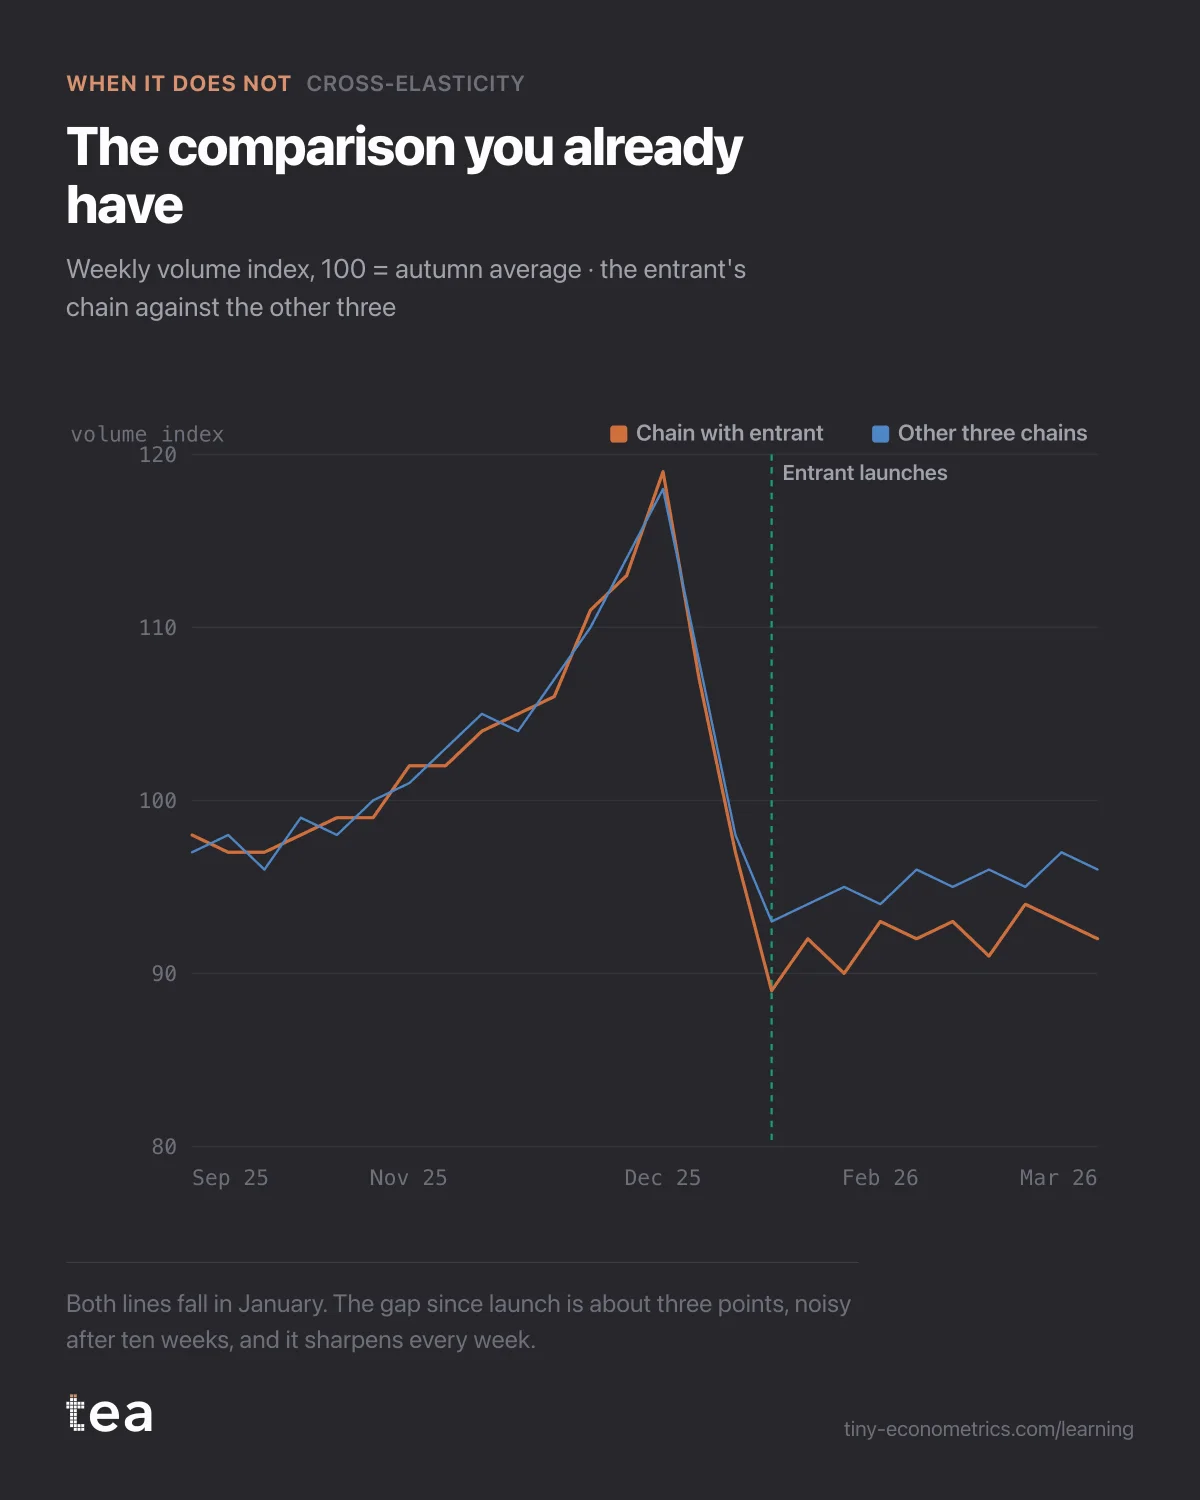
- Compare the chain with the entrant against the chains without it. The new brand was listed at one chain out of four. The other three share the same January and make a natural comparison group. Over the ten weeks the gap between the two was about three points: still noisy, but a cleaner read than the regression, and it improves every week.
- Track the facing count separately. If the loss lines up with the shelf change rather than the launch, the conversation is with the retailer, not about price.
- Ask the chain for the entrant's rate of sale. If it is selling a fraction of what its space requires, the chain will solve the problem in its next range review.
- Wait for their first price move. New brands rarely hold a launch price for long. The first promotion or price change creates the variation an elasticity needs. If the effect stays the same size, the interval at 26 weeks should be roughly half as wide as now, enough to exclude zero.
The brand did not cut its price. It went back to the chain about the lost facing, set up the four-chain comparison as a weekly report, and booked a re-run of the analysis for week 26.
The lesson
An elasticity needs the price to have moved. When a competitor is new and its price is flat, no amount of modelling turns ten weeks into a cross-elasticity, and pretending otherwise produces a number exactly as confident as the assumption behind it. Watch the comparison you already have, and let them move first. As the discount week case showed, once the variation arrives, the effect is often smaller than the fear.
tea, the product
Your file, this question
Fifteen analyses on a CSV of weekly data, with the intervals and the diagnostics shown, and a plain sentence when the data cannot answer. Free while in beta, by invitation.
Request a place in the beta→tea, the product
Fifteen econometric analyses on your own CSV: Cross-Elasticity, saturation curves, elasticities, budget allocation. Intervals and diagnostics shown, and a plain sentence when the file cannot answer.
Free while in beta, by invitation.
Request a place in the beta →Liked this? Run it on your own data.
tea runs Cross-Elasticity and fourteen other analyses on any weekly CSV, in minutes. Free while in beta, by invitation.
The Competitive Story
- Excess share of voice: where a challenger brand actually gained
- Share of voice when your monitoring service misses digital spend
- Competitor discount week: 2.1% of our volume, not the feared 8%
- A new entrant after ten weeks: too few to measure cross-elasticity
- Should we match a competitor's 25% discount? Lift, margin, hold (out October 20, 2026)
- Promotions that always coincide with the rival's cannot be split (out October 25, 2026)
- A lost share point, decomposed: their media, their price, our season (out October 30, 2026)