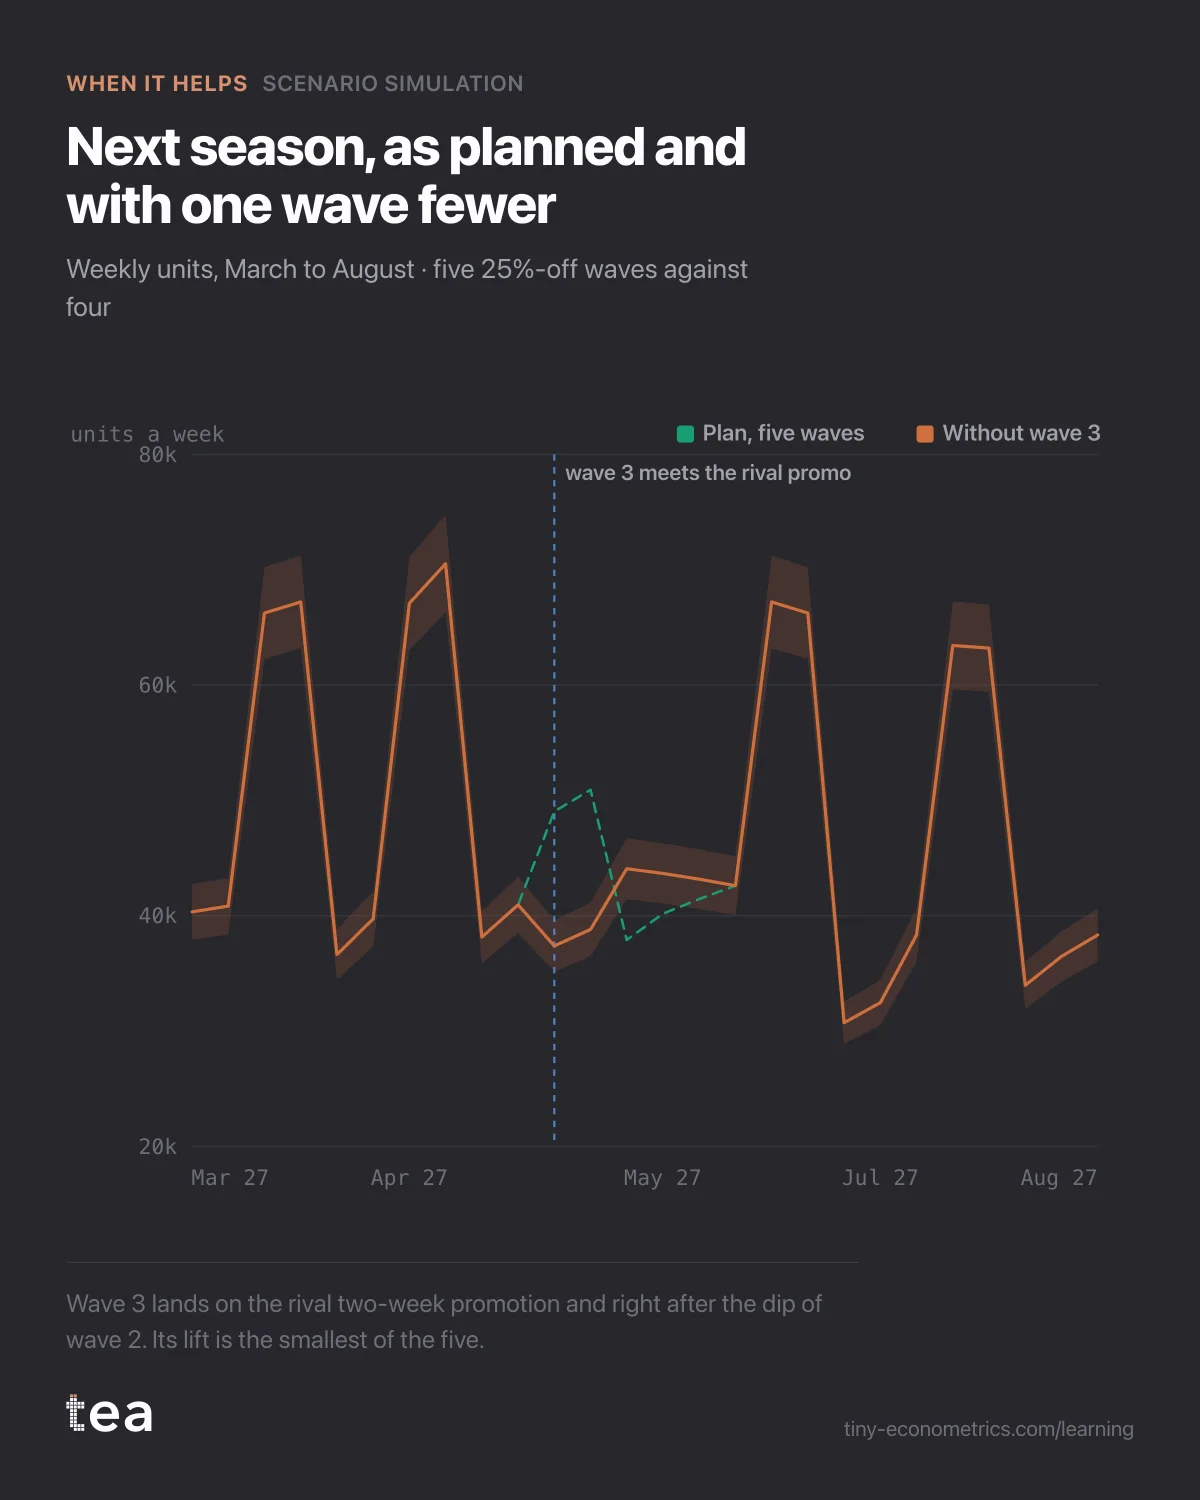
Household-goods maker, washing-up liquid in Italian grocery, testing next season's five-wave promo calendar before signing it with the retailer.
A composite case, built from the kind of file we see most weeks. It is the same household-goods maker as in the price post, a year later: the one-litre washing-up liquid, now at €3.66 after the 5% rise, about 42,000 bottles in an ordinary week, a unit cost of €2.20.
The retailer's joint business plan for March to August was on the table. It had five two-week promotion waves at 25% off, roughly every five weeks, which is what the brand had run the year before. The plan allowed a minimum of four. The commercial director's question: "Is there anything in this calendar we will regret?"
What the brand already knew
By this point the brand had run the Pricing & Promo path on its own file, and had three numbers, each with an interval.
- Own-price elasticity, -1.4, measured against the shelf around it.
- Promotion lift, net of the dip, measured as in the biscuit case: a 25% wave lifts the promotion weeks by about 60%, and the three weeks after give back 14%, 8% and 4%. About 22% of the lift is pull-forward.
- Cross-elasticity to the category leader: 0.6. When the leader is on a 20% promotion, the brand loses about 12.5% of its baseline in those weeks, and its own promotions in the same weeks lift less, because some of the shoppers it would have caught are buying the leader's offer.
The leader's calendar was not secret. Its promotions followed the same retailer's leaflet cycle every year, and the brand expected two windows: mid-May and early July.
Each of those numbers, used alone, says something simple. Promotion lift alone says every wave is the same wave. Cross-elasticity alone says the leader's weeks will hurt. Neither says what a particular calendar does, because what a wave is worth depends on what surrounds it.
What the analysis did
Scenario Simulation does not take three elasticities and run them side by side. It runs the model from Contribution Decomposition forward 26 weeks, which here was exactly March to August. The brand's price, its promotion depth and a flag for the leader's promotions went in as drivers, next to the season. Business as usual repeats last year's calendar week by week, which was the five-wave plan, and every scenario comes back with a P10 to P90 band from 1,000 draws of the model's coefficients.
The five-wave plan came back at about 1.24M bottles for the season, €3.96M of revenue and €1.23M of gross margin.
A scenario moves a driver across the whole horizon, by a percentage. So the simulator could say what the season looks like with every wave at 20% off instead of 25%, and it did: volume down 3.1%, margin up 4.4%. What it cannot do is remove one wave and keep the others. And the model under it adds each wave's lift on its own, so in it every wave of the same depth is worth the same. Which wave to drop is a question about what surrounds each one, and the file had to be told.
So the team added two columns and refitted. One carries the depth of the last wave into the three weeks after it, the dip the biscuit case measured. The other marks the weeks where the brand's promotion and the leader's run together. With those in, the model priced both: the dip at about 22% of a wave's lift, and the overlap at about a third of the brand's own lift.
Then the waves, one at a time, from the refitted model's coefficients. Most of them earned their usual volume. Wave 3 did not. It sat in the middle of May, in the same two weeks as the leader's first promotion, and its first week was the last week of wave 2's dip. Its lift was squeezed from both sides: the leader's offer took shoppers it would have caught, and some of the remaining demand had already been pulled forward into wave 2. Net of everything, wave 3 added about 12,000 bottles to the season. Wave 5, by comparison, added about 37,000.
Every 25% wave loses margin, because a bottle at €2.75 earns €0.55 against €1.46 at full price, and no wave tripled its volume. So the useful question was not whether a wave pays. It was which wave costs the most for the least.
The decision it changed
Two four-wave calendars, against the five-wave plan:
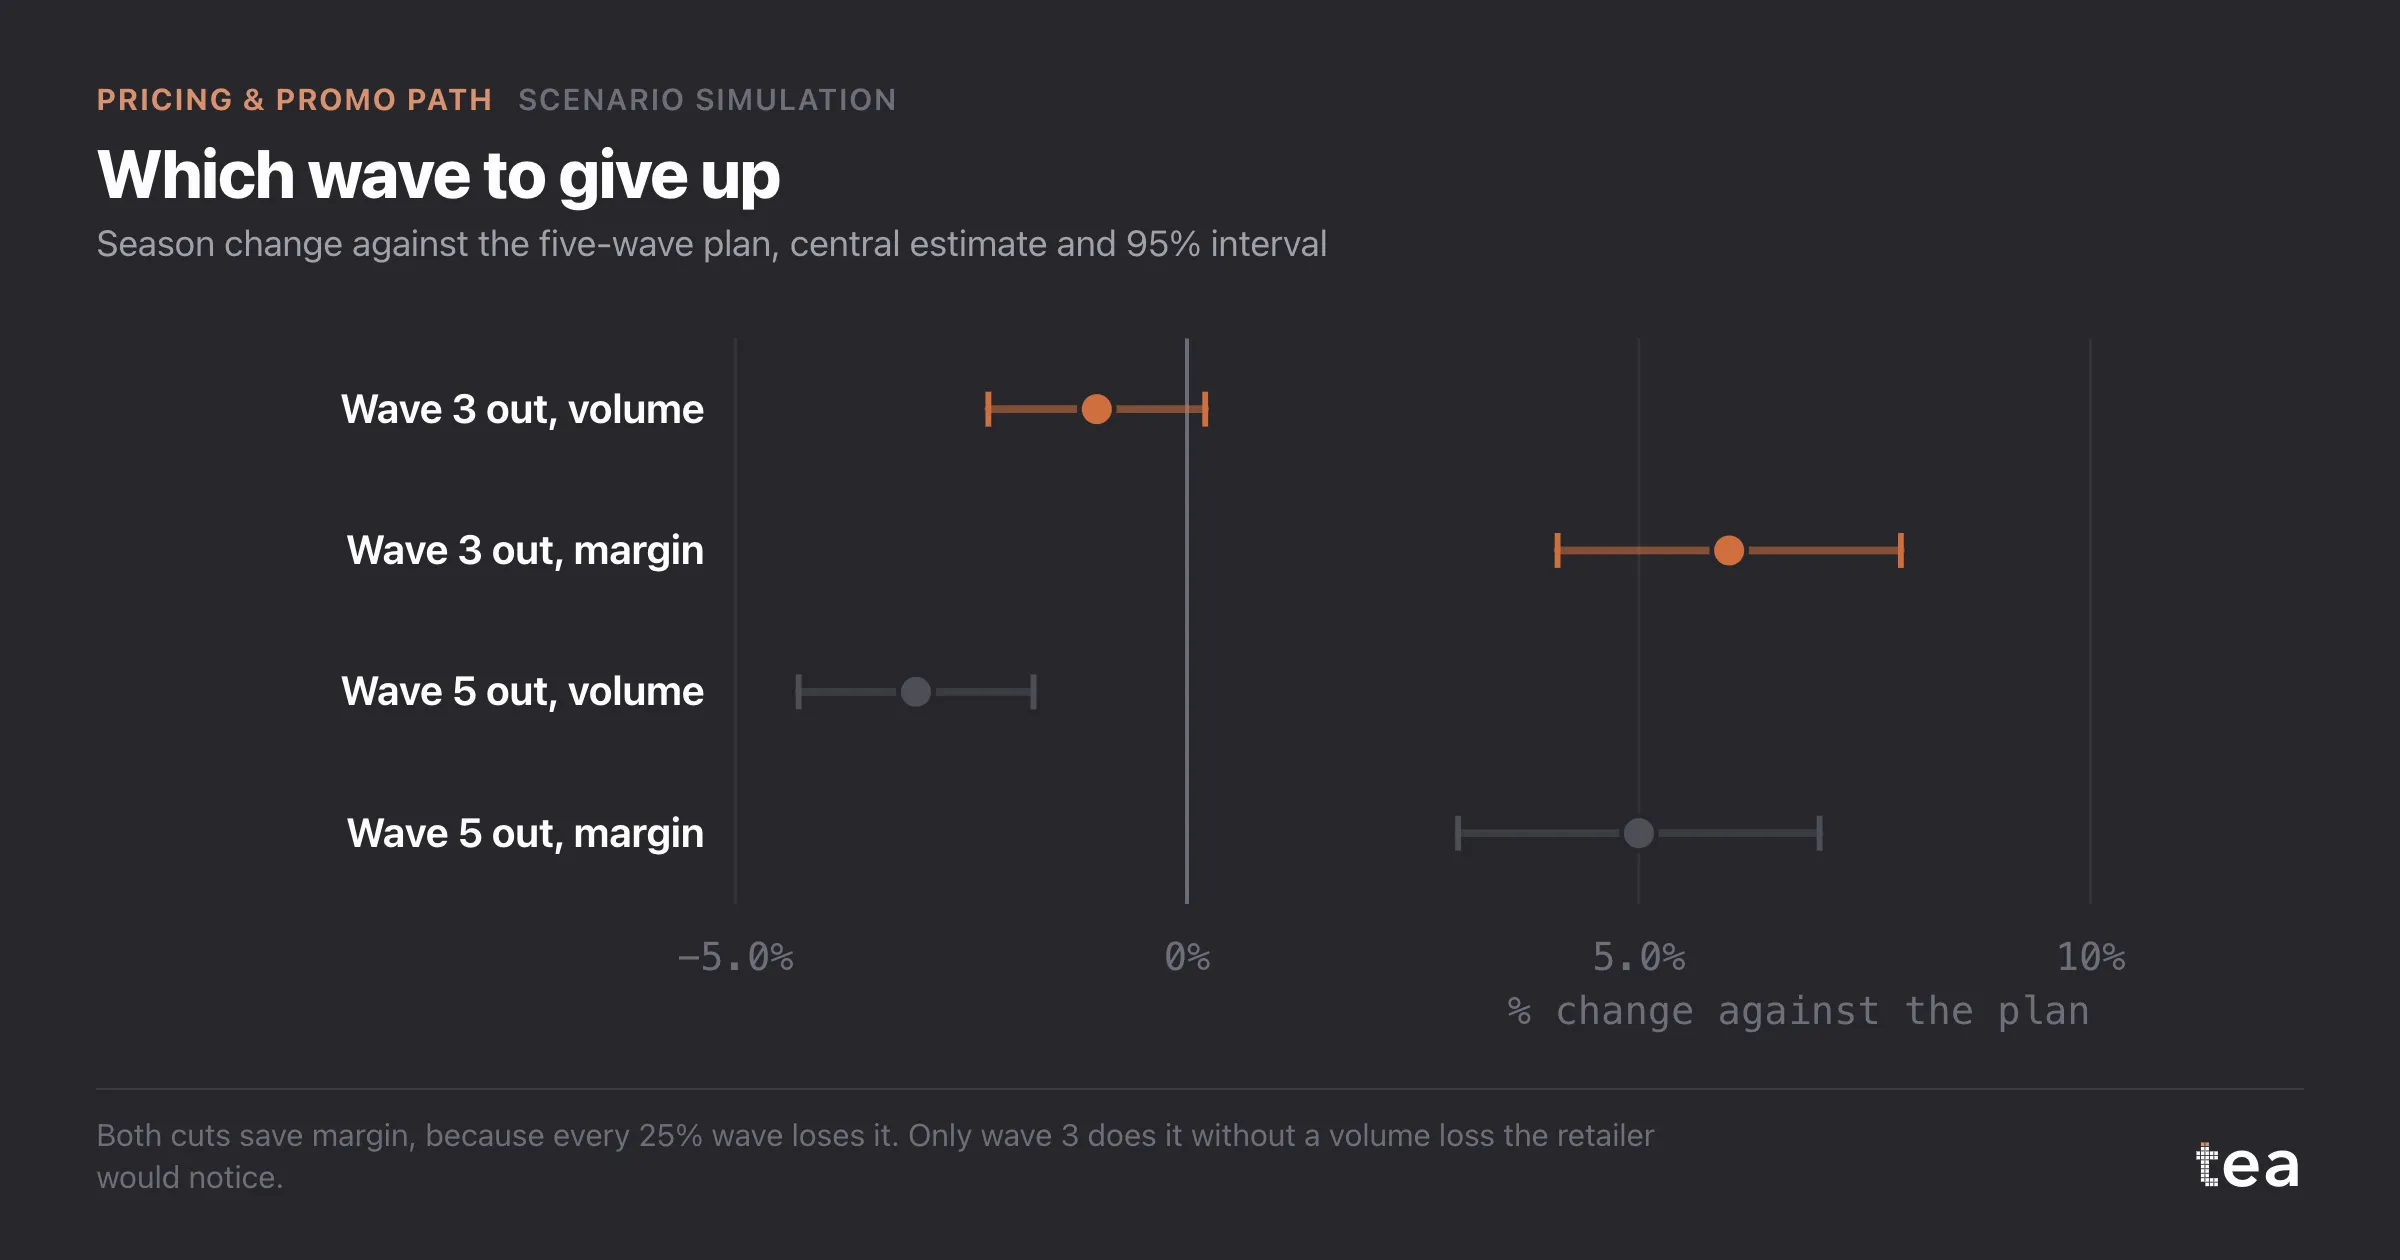
- Drop wave 3: season volume down 1.0%, with an interval from -2.2% to +0.2%. Revenue up 1.2%. Gross margin up 6.0%, from +4.1% to +7.9%, about €73k.
- Drop wave 5: season volume down 3.0%, from -4.3% to -1.7%. Revenue down 0.5%. Gross margin up 5.0%, from +3.0% to +7.0%.
Both save margin. The difference is volume. Dropping wave 3 costs a volume loss whose interval includes zero, which matters, because the retailer reads the season on volume and the brand had to sign the plan with them. Dropping wave 5 costs three times as much volume for a smaller margin gain.
Dropping both was the obvious next scenario, and the model put its margin gain at about 11%. It was also below the four-wave minimum in the retailer agreement, so it was not on the table, and the brand did not pretend it was.
The calendar was signed with four waves, the mid-May one removed, and the brand used the freed leaflet space for a display without a discount in the leader's second window, in July.
The lesson
An elasticity is a property of the product. The value of a promotion is a property of the calendar: what runs in the same weeks, and what ran just before. The three earlier steps on this path give you the numbers. Putting them in one model, with columns that say what surrounds each wave, is what turns three numbers into a plan you can sign, and sometimes into one fewer promotion than last year. A simulator only knows the calendar the file describes.
tea, the product
Your file, this question
Fifteen analyses on a CSV of weekly data, with the intervals and the diagnostics shown, and a plain sentence when the data cannot answer. Free while in beta, by invitation.
Request a place in the beta→tea, the product
Fifteen econometric analyses on your own CSV: Scenario Simulation, saturation curves, elasticities, budget allocation. Intervals and diagnostics shown, and a plain sentence when the file cannot answer.
Free while in beta, by invitation.
Request a place in the beta →Liked this? Run it on your own data.
tea runs Scenario Simulation and fourteen other analyses on any weekly CSV, in minutes. Free while in beta, by invitation.
The Pricing & Promo Story
- Price elasticity when your shelf price never moved in three years
- Price elasticity of -1.4 and why a 5% price rise still paid
- Promo lift net of pull-forward: the 30% discount that never paid
- Promo elasticity when you are on promotion 48 weeks a year
- Cross-price elasticity: which competitor actually takes your volume
- Cross-elasticity when competitor prices are only monthly
- Scenario simulation for a promo calendar: the wave worth dropping