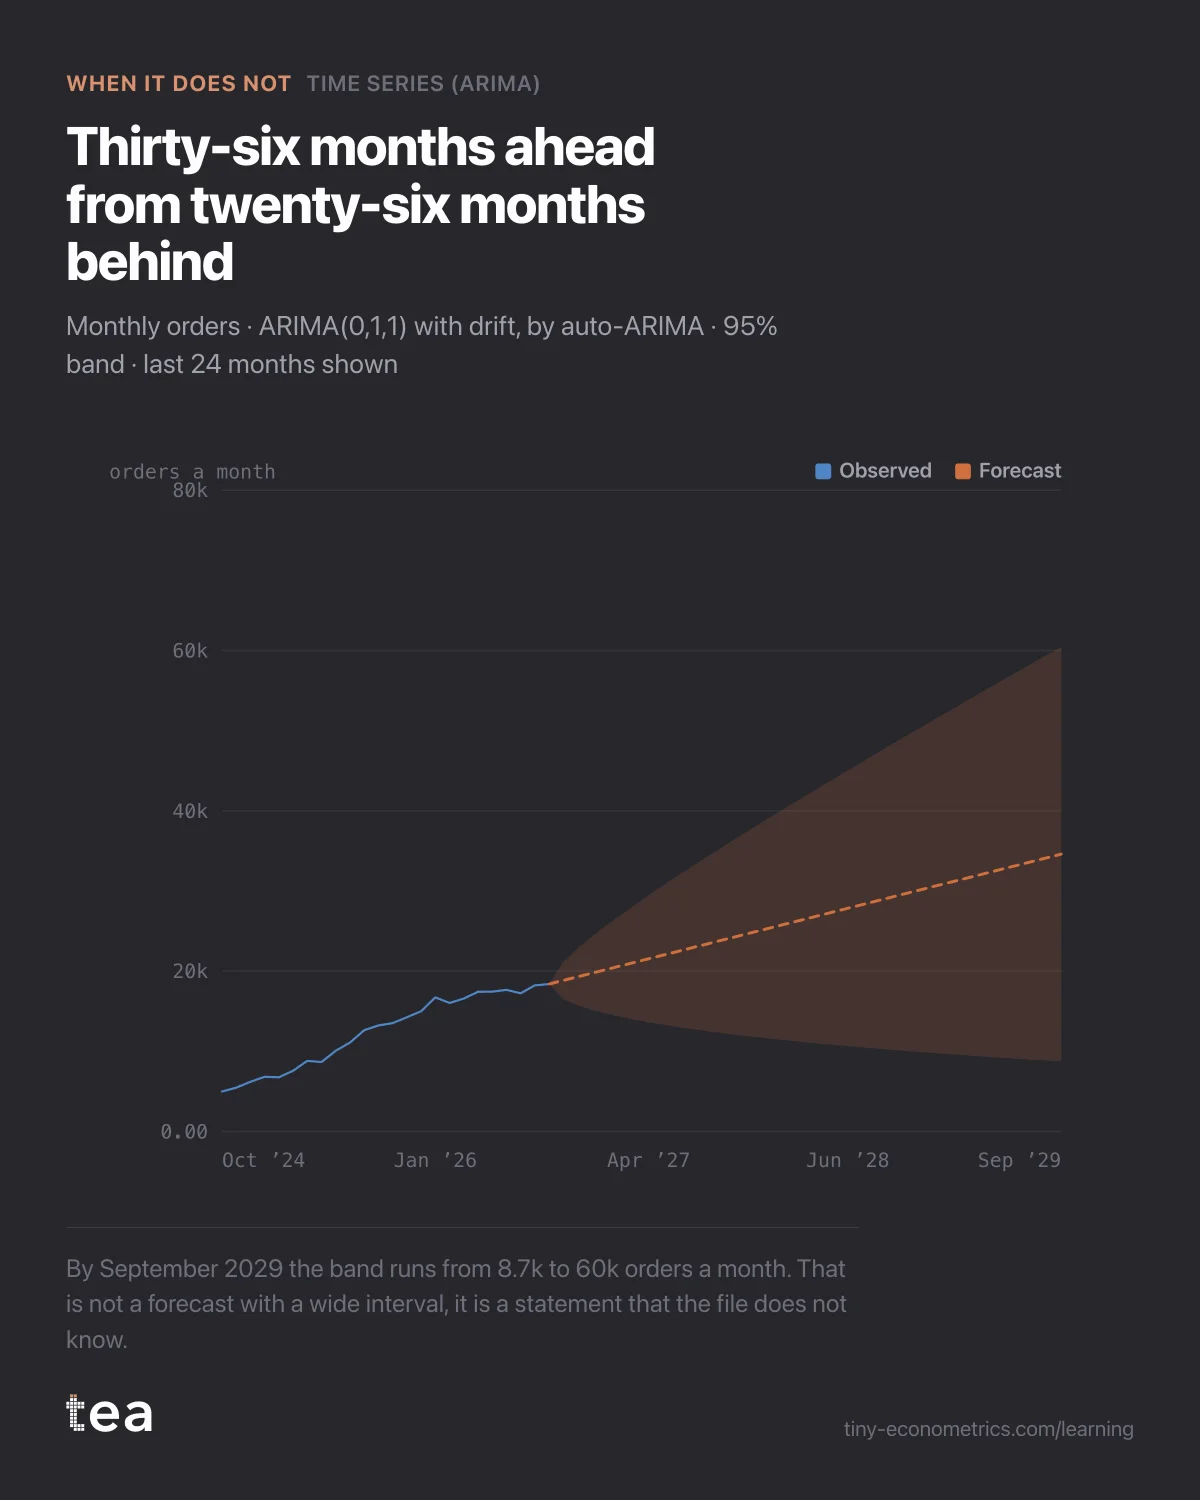
Spanish direct-to-consumer pet-food subscription, 26 months of monthly orders, asked for a three-year monthly forecast for a funding round.
A composite case, built from the kind of file we see most weeks. A direct-to-consumer pet-food subscription in Spain, launched in August 2024. Twenty-six months later it ships about 18,400 orders a month, and it is preparing a funding round.
The request was precise: "We need a monthly forecast of orders for the next three years, October 2026 to September 2029, for the investor model. Statistical, not a spreadsheet guess."
Thirty-six numbers, each one a month. tea projects twelve, and the file could not make even those mean much past the first few.
What the file looked like
26 monthly rows, one column of orders. The first month had about 4,500; growth was fast through 2025 and has been slowing since, to roughly 450 extra orders a month in the last half-year. No marketing column, no price column, no churn or cohort data.
Two features of the file decide everything that follows. It is short: 26 points is a small sample for any time-series model. And it covers only two Decembers, so whatever the yearly pattern is, it has been observed twice, both times while the business was doubling.
What the analysis did
Time Series runs auto-ARIMA: it fits a grid of candidate specifications, 32 without a season and 96 with one, and keeps the one with the lowest AIC, a score that rewards fit and penalises every extra parameter. Here it chose an ARIMA(0,1,1). In plain words: next month is this month, plus a correction for last month's surprise. There is no average monthly increase in it: once the series is differenced, the grid fits no drift term.
It also tried seasonal specifications and rejected them. With two Decembers, a yearly term costs parameters the data cannot pay for. So the forecast has no season in it at all, which is not a finding about pet food. It is a statement about the file.
The residual checks were fine. No autocorrelation left, nothing that suggested a missing term. The model was not the problem.
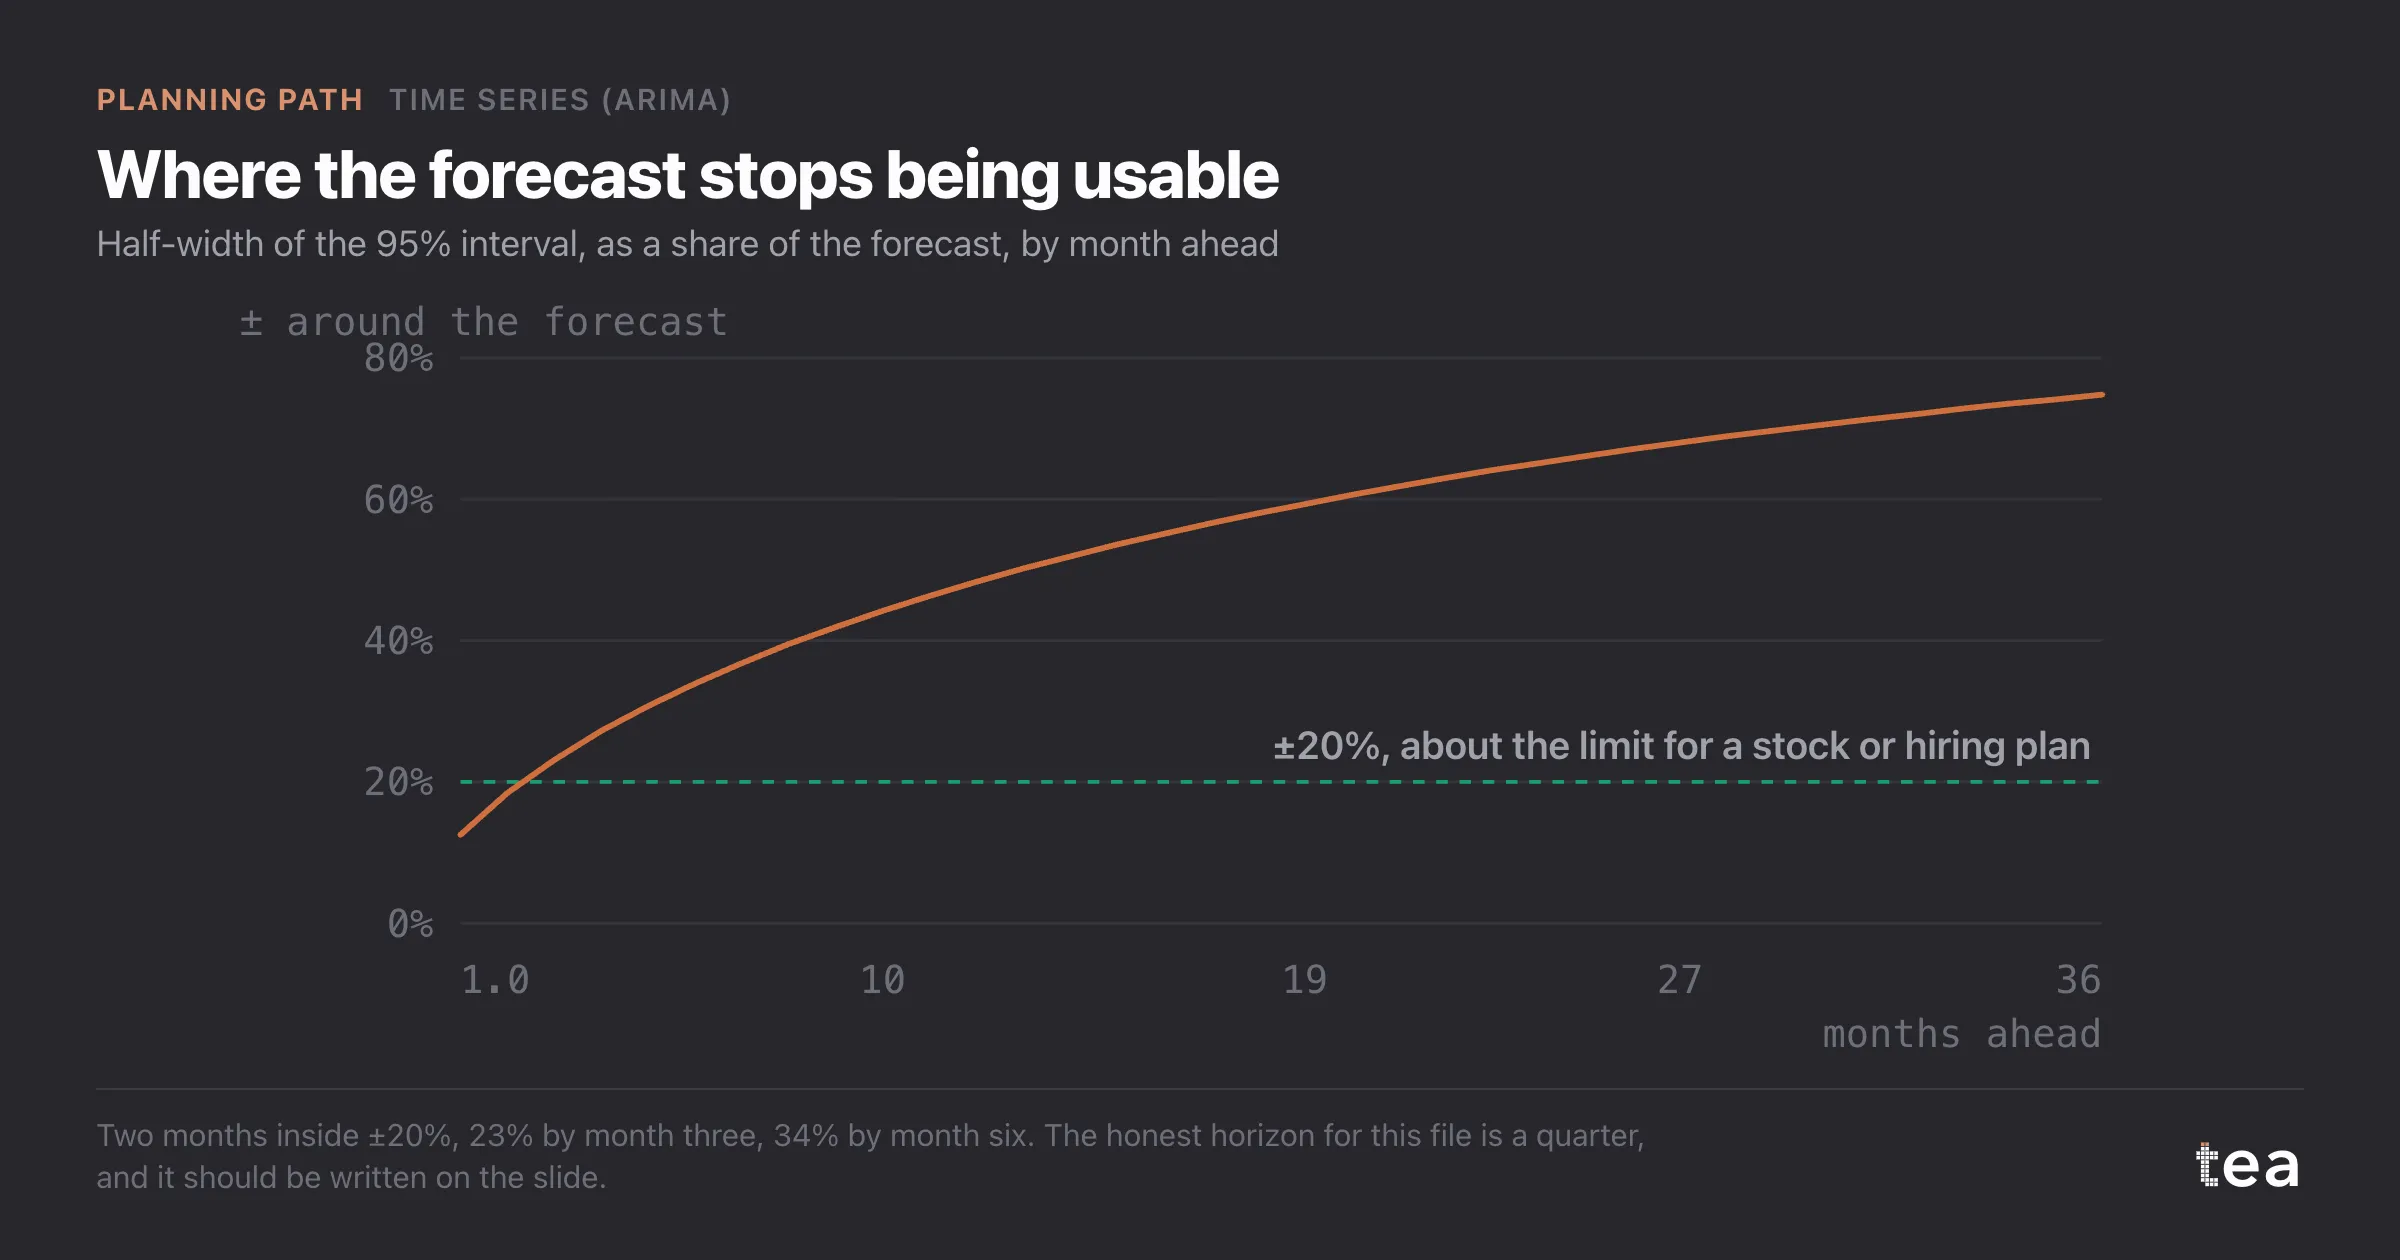
Then the forecast, twelve months ahead, which is as far as the module projects. Its 95% interval, as a share of the forecast itself:
- next month, plus or minus 12%;
- month three, plus or minus 17%;
- month six, plus or minus 22%;
- month twelve, plus or minus 30%.
The central line is flat, at about 18,600 orders a month. In September 2027 the interval runs from 13,000 to 24,200.
Why the maths cannot do better here
Two things decide that picture, and both come from the file.
The first is the flat line. The business added about 450 orders a month over the last half-year, and the model carries none of it forward. With 25 changes to learn from, each smaller than the one before, an average increase would have been a guess, and the specification without one scored better. That is the model declining to invent a slope, not a forecast that growth stops. Read the central line as the level today and nothing more.
The second is the band. Each month adds its own surprise, and surprises accumulate. By month twelve the band holds both the business that keeps its recent pace, about 24,000 orders a month, and the one that stalls where it is. A year out, the model cannot tell those two companies apart, and the investor model asked for three years.
More data of the same kind would not fix it quickly. Switching to weekly rows gives 113 points instead of 26, and it does narrow the first few weeks. It does not add years. The business has still lived through two Decembers and one slowdown, and no amount of resampling turns that into a long history.
Forcing it would have been easy: take the twelve months, drop the band, extend a straight line through the last year to fill the other 24, and paste 36 numbers into the investor model. That line would then become the growth story of the company, defended with the word "statistical", while the model itself was saying it had no idea.
What to do instead
Say the horizon out loud. On this file the usable horizon is about one quarter: three months inside plus or minus 20%. That is enough for stock and staffing decisions, and it is what the model should be used for.
For the three-year view, use scenarios, labelled as such. A low, middle and high growth path, each written as an explicit assumption about retention and acquisition, which the founders can defend and investors can challenge. The ARIMA forecast anchors the first quarter of all three; after that, they are judgement, and the slide should say so.
Then refit every month. Each new month adds one more change to learn the pace from, and the third December will be the first time a yearly pattern can be tested at all. Once there are drivers worth modelling, Scenario Simulation is where a plan gets bent by decisions, as the Planning Path intends.
The lesson
Every forecast has a horizon past which it stops informing and starts decorating. The interval tells you where that is, so read it before you read the line. Writing "usable to three months" on the chart is not a weakness of the analysis. It is the most useful sentence on the page.
tea, the product
Your file, this question
Fifteen analyses on a CSV of weekly data, with the intervals and the diagnostics shown, and a plain sentence when the data cannot answer. Free while in beta, by invitation.
Request a place in the beta→tea, the product
Fifteen econometric analyses on your own CSV: Time Series (ARIMA), saturation curves, elasticities, budget allocation. Intervals and diagnostics shown, and a plain sentence when the file cannot answer.
Free while in beta, by invitation.
Request a place in the beta →Liked this? Run it on your own data.
tea runs Time Series (ARIMA) and fourteen other analyses on any weekly CSV, in minutes. Free while in beta, by invitation.
The Planning Story
- A baseline forecast for the budget: 3% of the 8% was already coming
- When the past is not a baseline: forecasting after a lost account
- Three-year forecast from 26 months of data: say the horizon out loud
- Weekly demand forecasting with ARIMA: setting stock on the interval
- Measuring a one-off event: why one sponsorship cannot be isolated (out October 19, 2026)
- Seasonal indices with a weather control: stop planning on last March (out October 24, 2026)
- Doubling media spend in a scenario: what a simulator cannot know (out October 29, 2026)