Home and kitchen e-commerce brand in France and Belgium, €38M a year, asking whether to cut TV because last-click ranked it last.
A composite case, built from the kind of file we see most weeks. A home and kitchen brand selling online in France and Belgium, about €38M of revenue a year and €4.2M of media: €1.6M on TV, €0.9M on branded search, €0.8M on generic search and €0.9M on paid social.
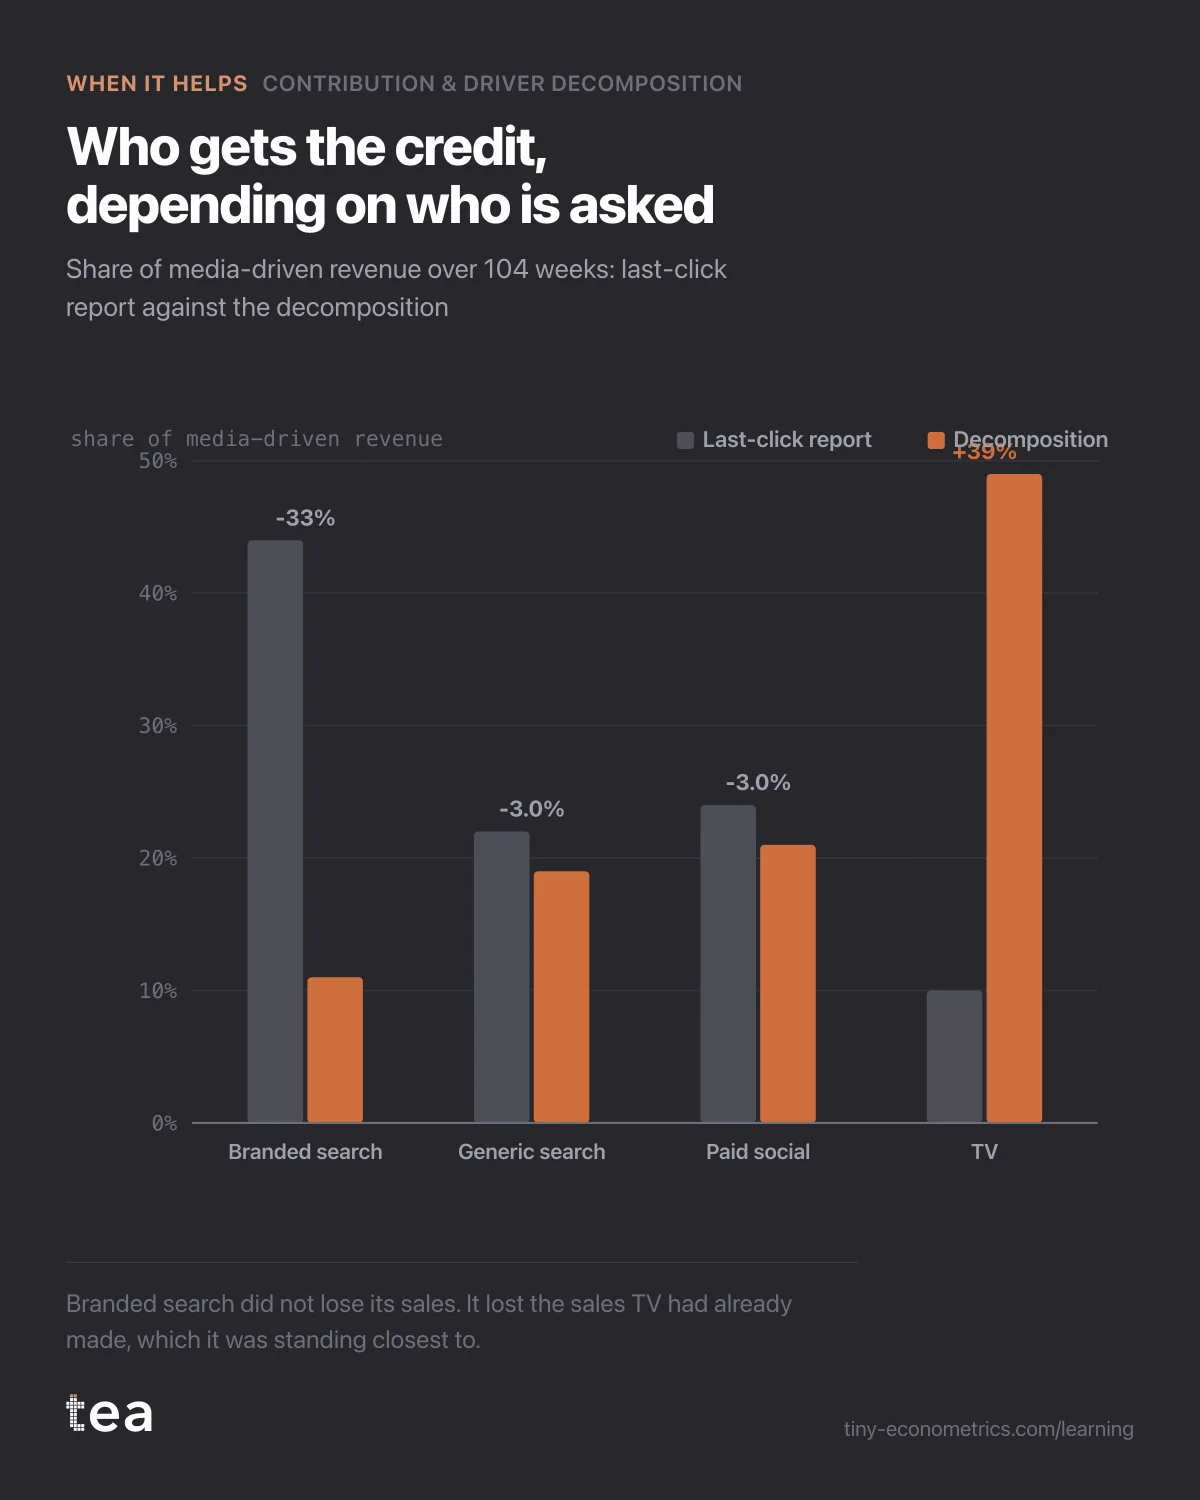
The analytics report used last click. It gave branded search 44% of the revenue attributed to media, social 24%, generic search 22% and TV 10%. Read that way, TV was the most expensive channel and the least productive. The question arrived from the finance director, in so many words: "Last click says TV is our worst channel. Why are we still buying it?"
What the data looked like
104 weekly rows. Revenue, spend by channel, TV GRPs, branded search clicks and impressions, a discount column and a price index.
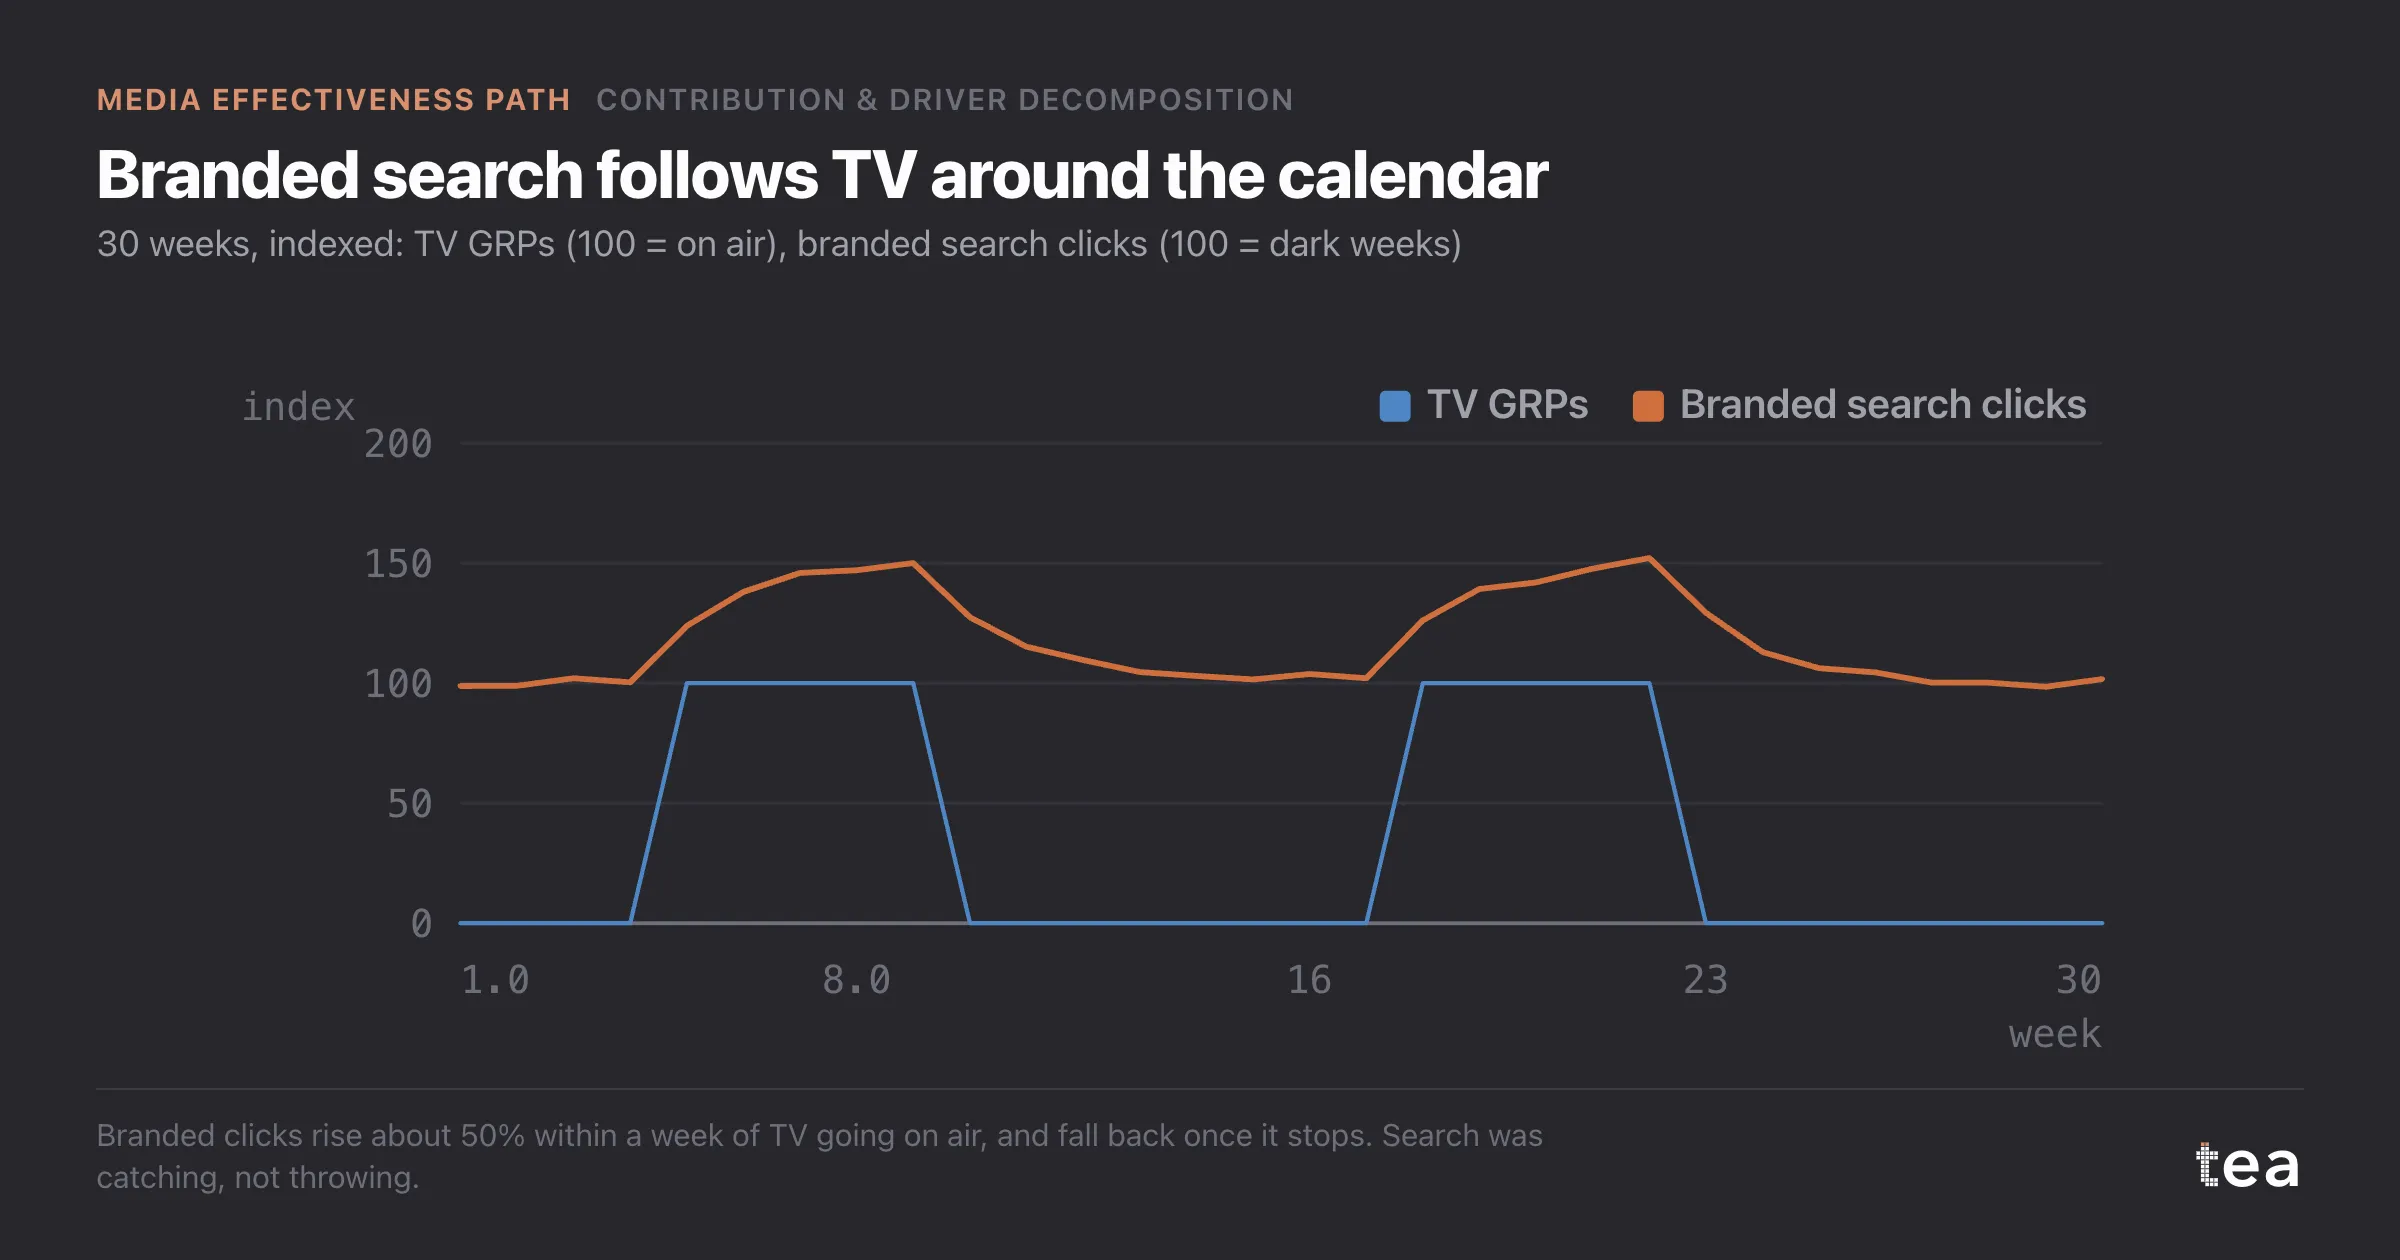
Two features made the file readable. TV ran in six flights of five or six weeks, with dark weeks in between, so it had real on and off contrast. And branded search clicks were in the file as a column, not just branded search spend. That column turned out to be the whole story.
Plot branded clicks against the TV calendar and they move together. Within a week of TV going on air, branded clicks rose by about half. When TV went dark, they fell back by roughly a third. People saw the advert, remembered the name, and typed it. Branded search was standing at the door when they arrived.
What the decomposition did
Contribution Decomposition is a regression model of weekly revenue, with every channel entered as spend that has already been spread over time by its carryover and bent by its saturation curve, the two things the earlier steps of the path estimate. It splits each week's revenue into a base and a contribution per driver.
The first run did the obvious thing and put branded search spend next to TV as two parallel drivers. The diagnostics did not like it. The variance inflation factor between the two was 4.8, which means they were largely telling the same story, and branded search, which moves a few days later and sits right next to the sale, took most of the credit for it. That run gave branded search 31% of media contribution and TV 24%.
The problem was not the maths but the order. Branded search was not a parallel cause of sales. It was partly an outcome of TV. So before the second run, we added a column to the file: branded clicks net of the part that TV's adstocked GRPs explained, from a simple regression of one on the other. That residual is branded demand that TV did not create: loyal customers, word of mouth, the newsletter. It went into the model in place of raw branded spend.
The second decomposition gave TV 49% of media contribution, social 21%, generic search 19% and branded search 11%. TV's interval was wide, as it should be, but it did not come near 10%.
The verdict
This one helps, and it changed two decisions.
The TV cut did not happen. Instead, branded search bids were cut by 35% on pure brand terms where the brand's own organic listing already ranked first, while bids stayed in place where competitors were bidding on the brand name. That saved about €160k over the half year, and the saving paid for two extra weeks of TV.
A quarter later, paid branded clicks were down 31%, organic brand clicks were up 24%, and total brand-term traffic was down 4%. Revenue came in 0.6% above the forecast, inside its interval of plus or minus 1.8%. The people who were going to search for the brand still searched for it. They just clicked the free link.
Two cautions belong next to the result. A decomposition is not an experiment, and the split depends on the order we assumed: TV creates searches, not the other way round. That order is well supported here by the timing and by the dark weeks, but it is an assumption, and it should be written down. And the carryover matters: without it, TV's effect in the weeks after a flight would have been handed to whatever was still running.
The lesson
A channel that sits close to the sale is not necessarily the one that caused it. Before you split the credit, decide which drivers can cause which, and put the ones that are partly consequences into the model as consequences.
tea, the product
Your file, this question
Fifteen analyses on a CSV of weekly data, with the intervals and the diagnostics shown, and a plain sentence when the data cannot answer. Free while in beta, by invitation.
Request a place in the beta→tea, the product
Fifteen econometric analyses on your own CSV: Contribution & Driver Decomposition, saturation curves, elasticities, budget allocation. Intervals and diagnostics shown, and a plain sentence when the file cannot answer.
Free while in beta, by invitation.
Request a place in the beta →Liked this? Run it on your own data.
tea runs Contribution & Driver Decomposition and fourteen other analyses on any weekly CSV, in minutes. Free while in beta, by invitation.
The Media Effectiveness Story
- Adstock and the outdoor burst that was judged on the wrong week
- Why flat always-on spend makes carryover impossible to measure
- A TV saturation curve fitted on only two spend levels
- Paid social past the bend: the saturation curve behind a cheap cut
- Contribution decomposition: when branded search harvests TV demand
- When a budget optimiser says move 60% into one channel (out October 21, 2026)
- A media budget reallocation, executed and read a quarter later (out October 26, 2026)
- Geo MMM: the national average that hid a north and south split (out October 31, 2026)