Northern English craft brewery, 156 weeks of volume, sponsored a single regional cup final, asked for the uplift before deciding on renewal.
A composite case, built from the kind of file we see most weeks. A craft brewery in the north of England, selling through about 600 pubs and two supermarket chains. In late May 2026 it sponsored a regional cup final: pitch-side boards, the name on the match programme, and a mention in the regional broadcast.
The question arrived in September, with a renewal offer attached: "Sales jumped the week of the final. We need to know how much of that was the sponsorship before we sign for next year."
It is a reasonable question, and the file could not answer it.
What the file looked like
156 weekly rows, three years, one column of volume in hectolitres, plus an events calendar the marketing team had kept: Christmas, Easter, bank holidays, and the final. No regional split, no separate pub and supermarket columns, no record of retailer promotions.
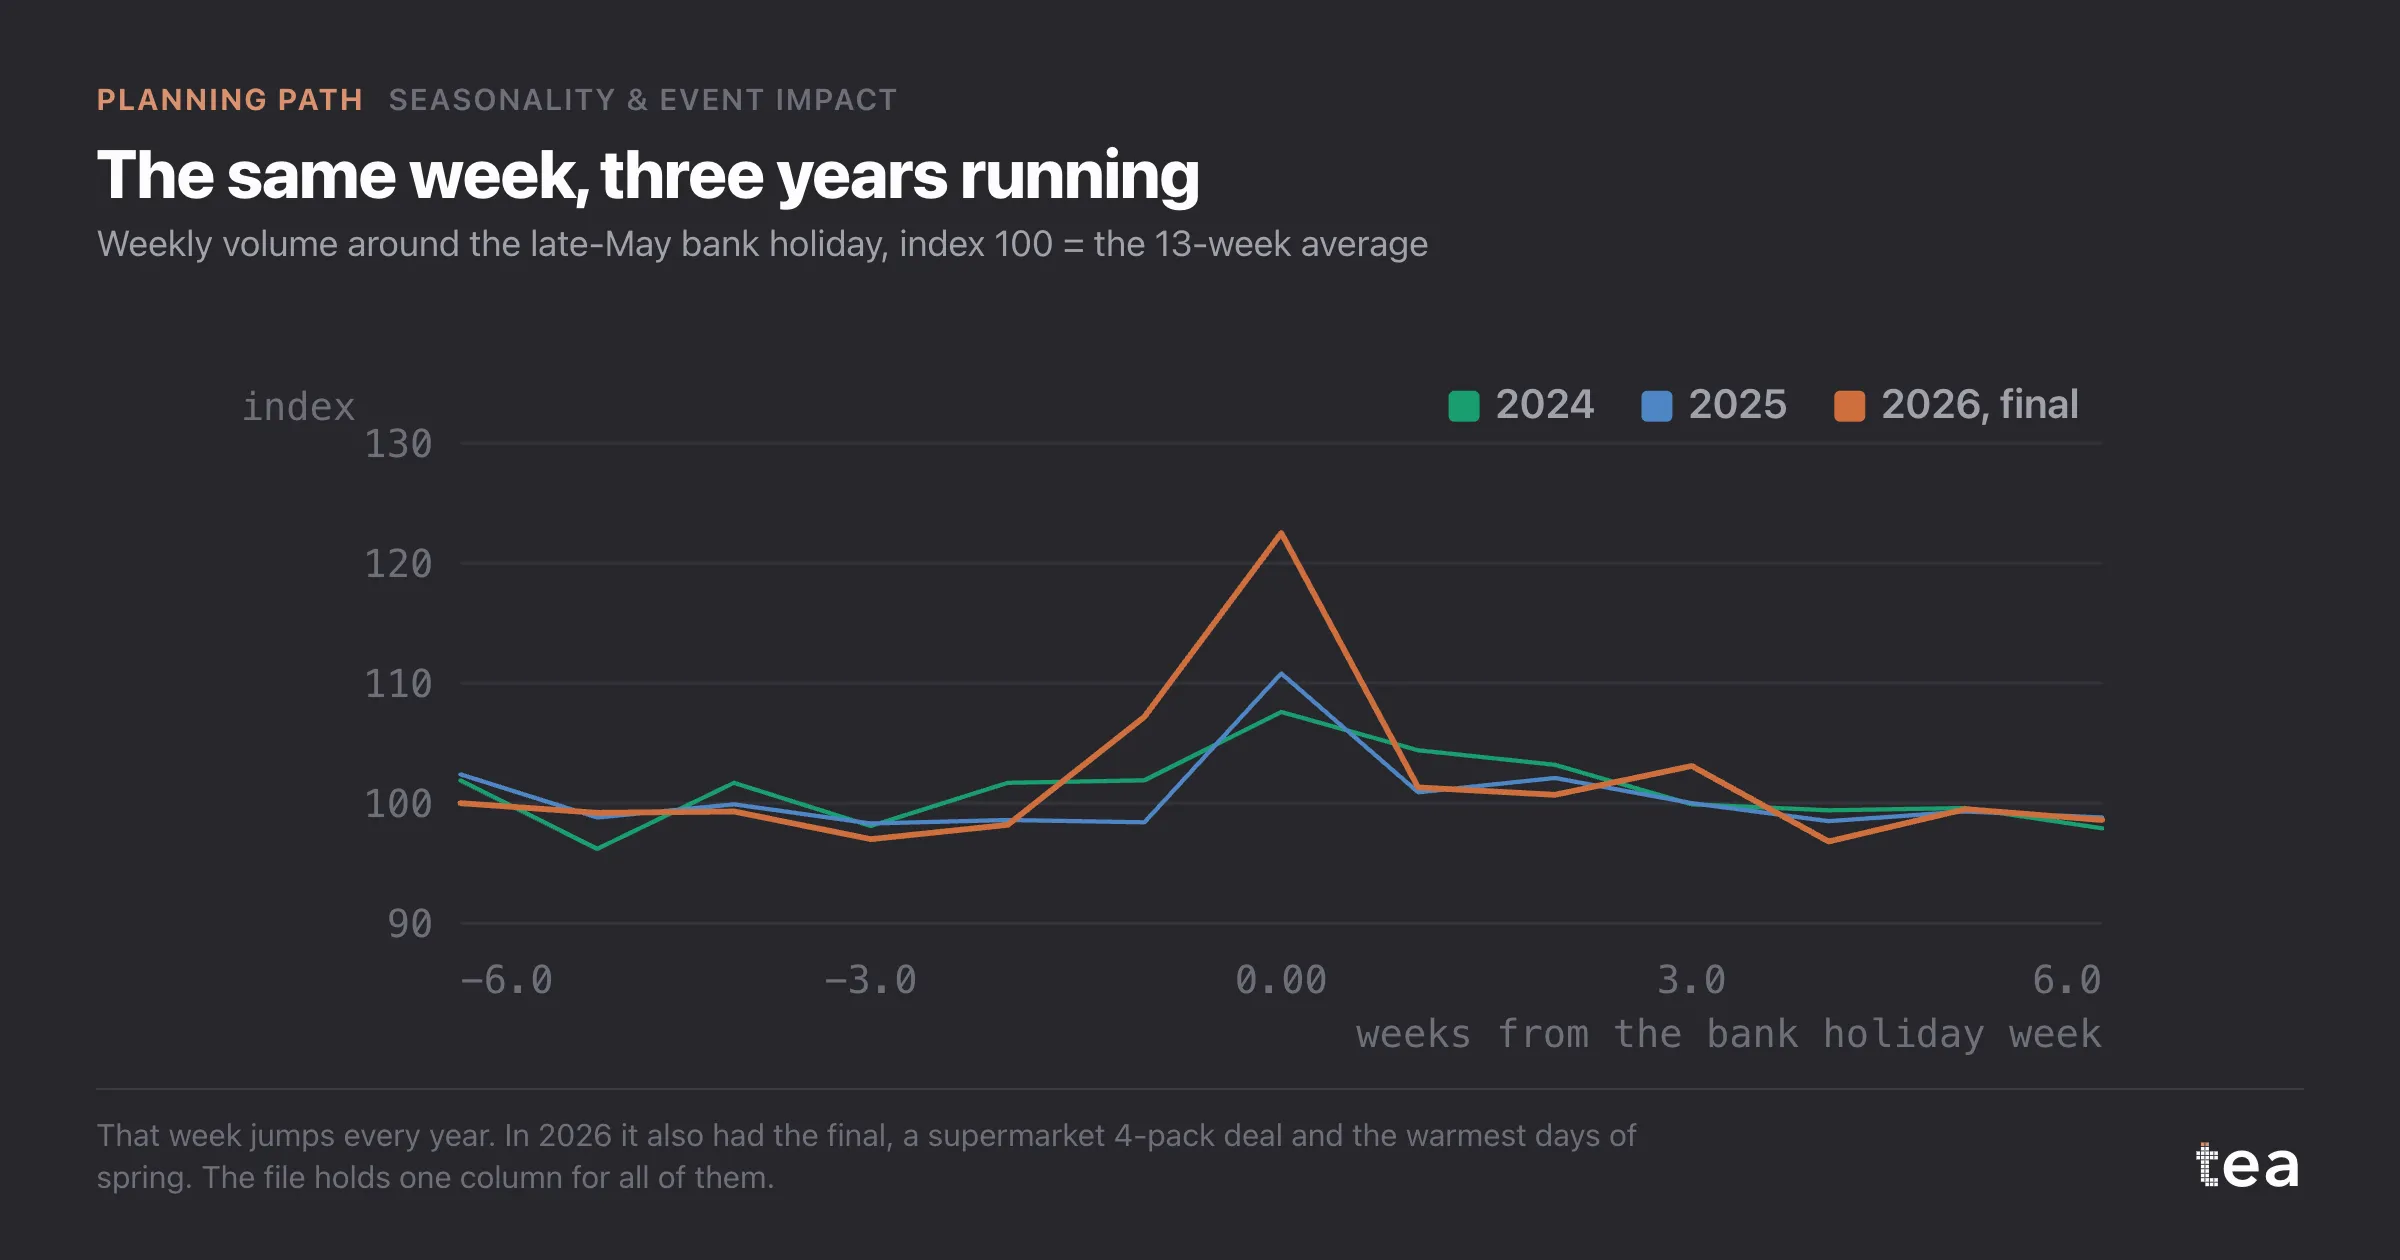
The week of the final was indeed high. Against the average of the six weeks either side it was up 24%. But that week also contained the late-May bank holiday, the first properly warm days of the spring, half-term in most of the region, and, it turned out later, a supermarket deal on the brewery's 4-pack that nobody in marketing had been told about.
What the analysis did
Seasonality & Event Impact fits one regression: a trend, a dummy for each month, and a dummy for each event, a column that is 1 in the event's weeks and 0 everywhere else. The coefficient on an event dummy is the average difference between the weeks it marks and what month and trend predict for them. Its interval comes from how much those weeks vary around that average.
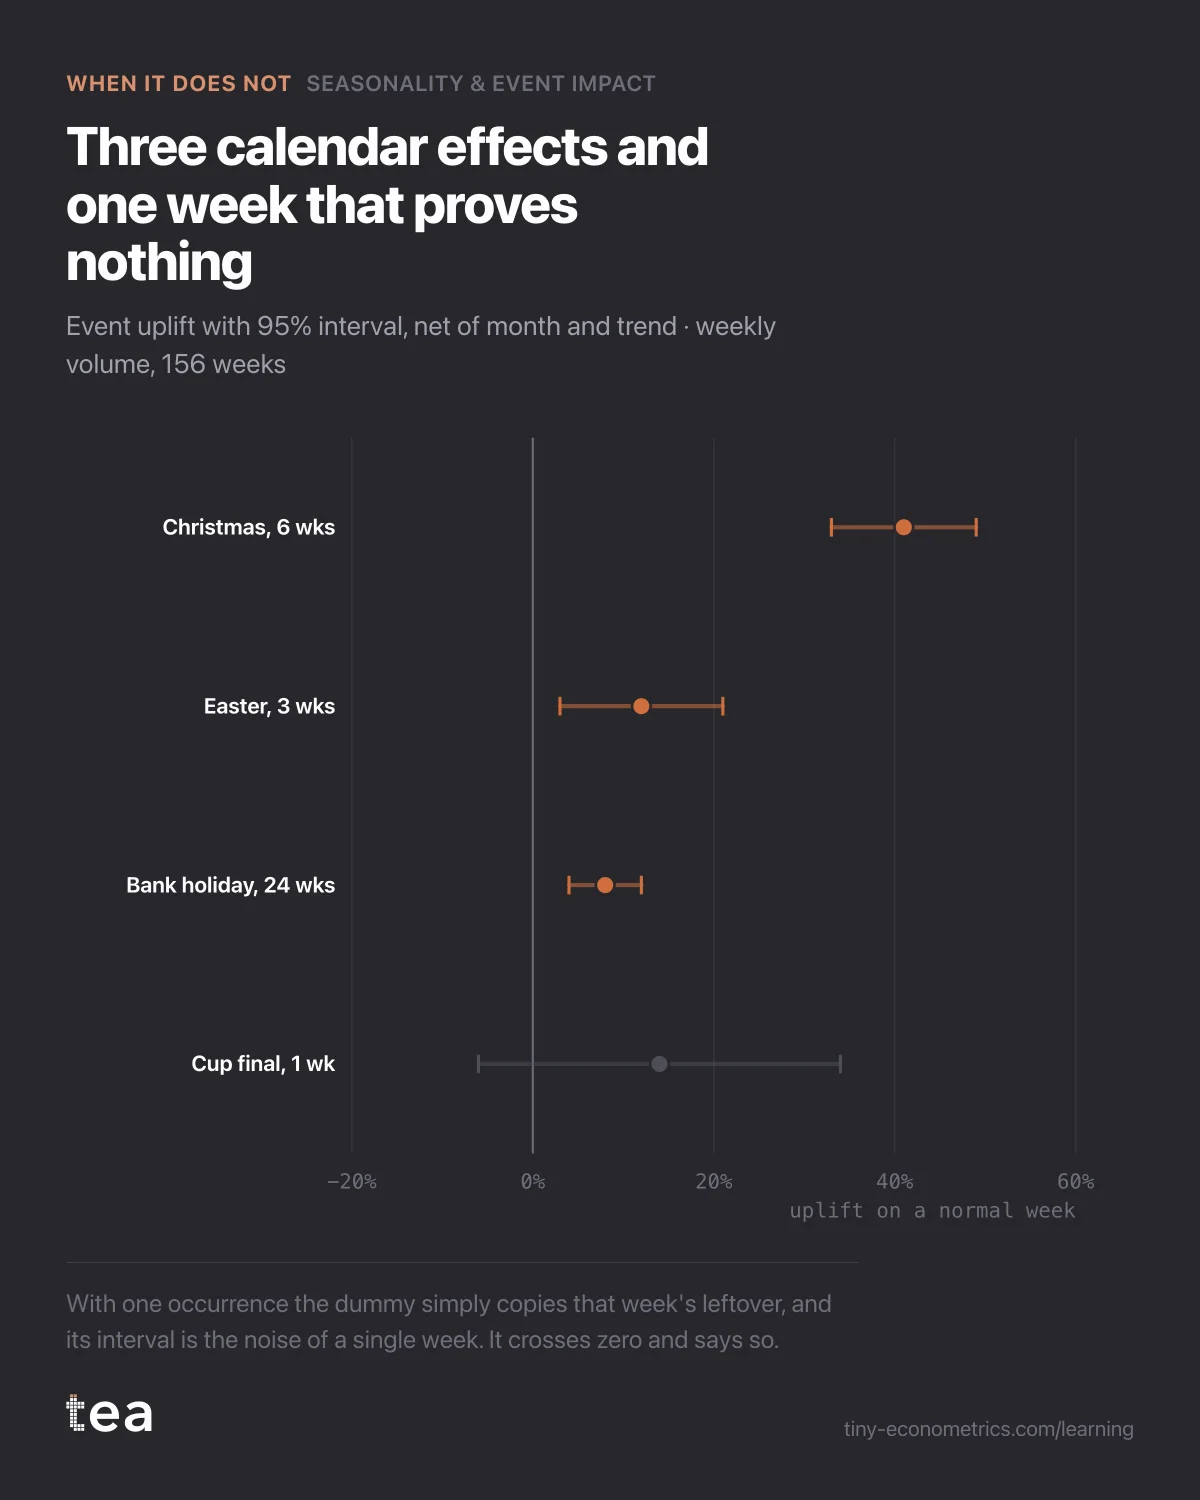
For Christmas, that works well. The dummy marks six weeks across three years, and the estimate, +41%, has an interval from +33% to +49%. Easter, three weeks, +12%. Bank holidays, 24 weeks, +8%, tight.
For the final, the dummy marks one week. With one week, there is no average to compute: the coefficient simply equals whatever that single week did beyond the rest of the model. Everything unexplained in that week, the weather, the 4-pack deal, half-term, a delivery that landed late from the week before, ends up in it. The estimate came out at +14%, net of the average bank holiday. Its 95% interval ran from −6% to +34%.
The product also flagged an overlap: the final's dummy and the bank-holiday dummy are both on in the same week. That is the model saying, in its own way, that it is being asked to split one observation between two causes.
Why it cannot be done from this file
The interval is the honest part. With a single occurrence, the uncertainty on the event is the uncertainty of one ordinary week, and in this business one ordinary week moves around by about 10%. No estimator can do better, because the information is not there. The interval includes zero: on this data, the sponsorship may have done nothing.
And the interval is the optimistic version. It assumes that everything else in that week is accounted for, which it is not. The supermarket deal is in the week and not in the file. Warm weather is in the week and not in the file. Each of them could account for the whole +14% on its own.
The chart of the same week across three years makes the point without any statistics. In 2024 and 2025, with no final and no sponsorship, that week was up 11% and 8%. It is a strong week every year.
Forcing it would have been easy. The agency's recap credited the sponsorship with the full 24% jump. Taken at face value, that number would have justified renewing at the higher fee, and would then have been compared next year with a week that has its own bank holiday, its own weather and perhaps its own promotion. A single-week story repeated each year, never once measured, is how sponsorships become permanent.
What to do instead
- Decide whether it is a measurable thing at all. If the sponsorship is a relationship with the region, renew or cancel on judgement and say so. That is a legitimate decision; it just should not be dressed as an econometric one.
- If it should be measured, make it repeatable and separable. A three-year renewal gives three occurrences, still few. Better is a regional contrast: the broadcast covers one region, and pub volume split by region would let the sponsored area be compared with the others in the same week. That needs a regional column, which the brewery can get from its distributor.
- Clean the week. Ask the supermarket for the promotion calendar, and do not schedule a 4-pack deal in the sponsored week. One fewer cause makes the remaining one easier to see.
The next post in this thread is the opposite case: a cause that recurs often enough to be measured.
The lesson
An event that happened once is not a sample, it is an anecdote with a date. A model can put a number on it, but the number is that week's noise with a label attached. Before asking what an event was worth, count how many times it happened, and what else happened in the same weeks. If the answer is "once" and "a lot", the honest next step is to design the next one so that it can be measured.
tea, the product
Your file, this question
Fifteen analyses on a CSV of weekly data, with the intervals and the diagnostics shown, and a plain sentence when the data cannot answer. Free while in beta, by invitation.
Request a place in the beta→tea, the product
Fifteen econometric analyses on your own CSV: Seasonality & Event Impact, saturation curves, elasticities, budget allocation. Intervals and diagnostics shown, and a plain sentence when the file cannot answer.
Free while in beta, by invitation.
Request a place in the beta →Liked this? Run it on your own data.
tea runs Seasonality & Event Impact and fourteen other analyses on any weekly CSV, in minutes. Free while in beta, by invitation.
The Planning Story
- A baseline forecast for the budget: 3% of the 8% was already coming
- When the past is not a baseline: forecasting after a lost account
- Three-year forecast from 26 months of data: say the horizon out loud
- Weekly demand forecasting with ARIMA: setting stock on the interval
- Measuring a one-off event: why one sponsorship cannot be isolated
- Seasonal indices with a weather control: stop planning on last March (out October 24, 2026)
- Doubling media spend in a scenario: what a simulator cannot know (out October 29, 2026)