Archive for the category

Trend Analysis

The structural slope of a series, with its confidence band, read before anything else gets credit for growth. Where a trend line helps, and where it averages two different businesses into one. How to read it, and where it misleads.

A step of the Discovery Story.

Setting sales targets against the trend line, not last year
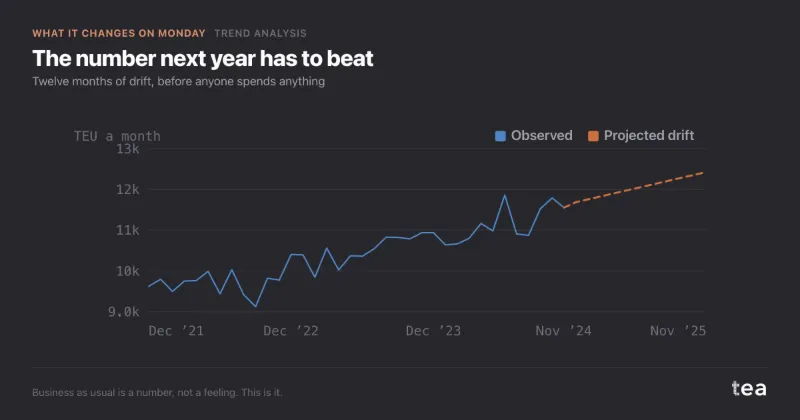
Next year's target is being set somewhere right now, and in most rooms it is being set by adding a percentage to this year.

Here is the alternative, and it takes about a minute.

Continue reading →

Filed under Trend Analysis  |  Permalink
Testing a trend line: residuals, ADF and KPSS before you plan

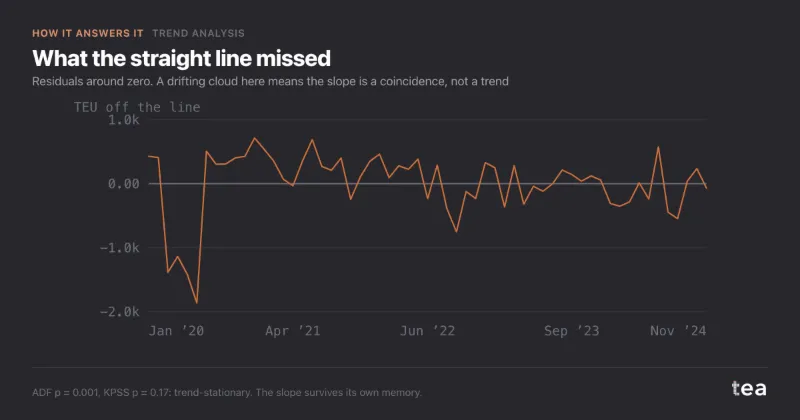
A trend line will fit anything. That is the problem with trend lines.

Draw one through a random walk and you get a slope, an R², and a story. The slope is real in the sense that the arithmetic is correct. It is not real in the sense that next year will follow it.

Continue reading →

Filed under Trend Analysis  |  Permalink
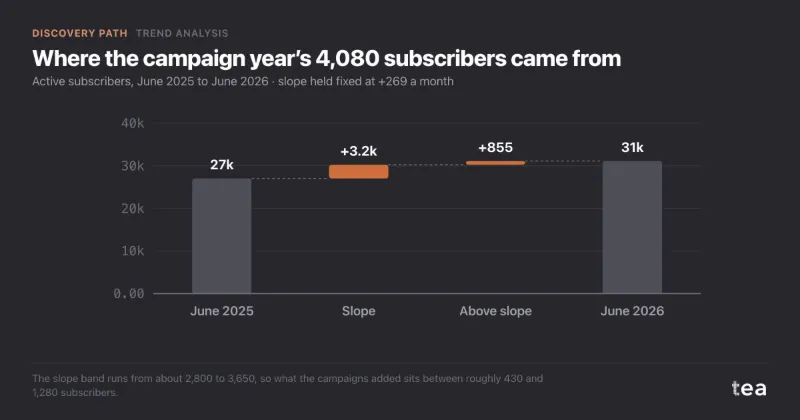
Subscription growth from marketing, or a slope already there

Coffee subscription business in the Netherlands and Belgium, 36 months of active subscribers, asked whether doubling campaign spend doubles growth.

A composite case, built from the kind of file we see most weeks. A coffee subscription business selling in the Netherlands and Belgium, around 31,000 active subscribers, a monthly box, and a first year of paid campaigns behind it.

Continue reading →

Filed under Trend Analysis  |  Discovery Story  |  Permalink

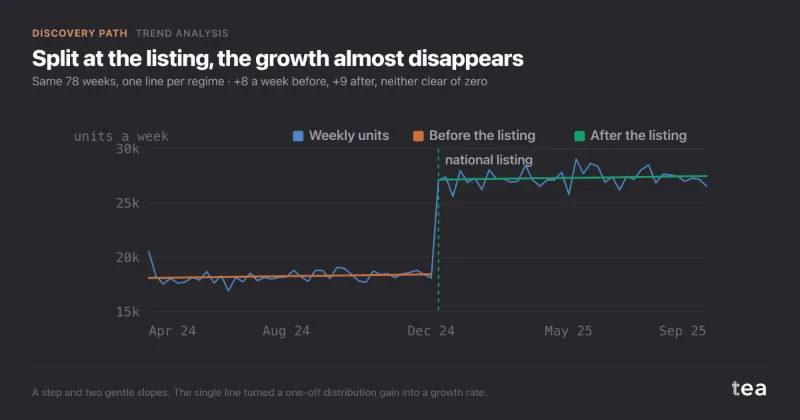
Trend analysis with a structural break, and why one line lies

UK premium crisps brand, 78 weeks of retail units, asked whether next year can be planned on its growth rate.

A composite case, built from the kind of file we see most weeks. A premium crisps brand in the UK, about £2.5M a year at retail, with a small commercial team and a forecast due for the annual plan.

Continue reading →

Filed under Trend Analysis  |  Discovery Story  |  Permalink

Trend analysis: separating structural growth from marketing

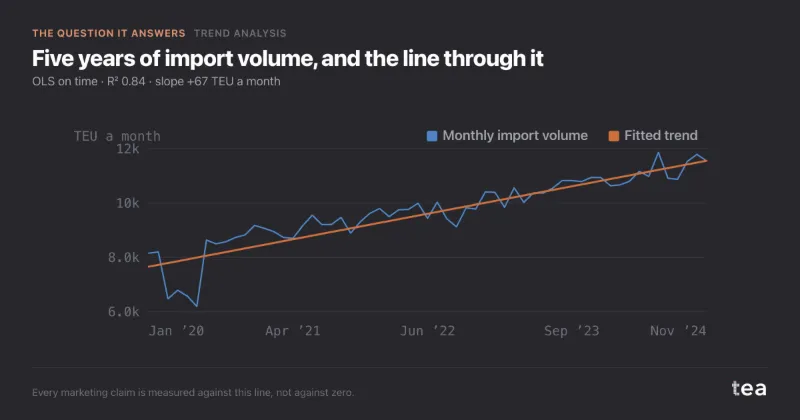
Five years of import volume at a logistics operator. The thin line is what happened. The straight one is what a regression says was always going to happen.

The slope is +67 TEU a month. Across the 59 months in the file that is the distance between 8,154 and 11,552 containers, and not one of them was bought.

Continue reading →

Filed under Trend Analysis  |  Permalink