Italian fresh-pasta producer, 104 weeks of cases shipped, one key account lost mid-way, asked for next year's business-as-usual volume.
A composite case, built from the kind of file we see most weeks. A fresh-pasta producer in Emilia, about 140 people, shipping to supermarket chains in Italy and Austria. One of those chains, a discounter, moved its fresh pasta to private label and took its last delivery in mid-December 2025. It had been about 18% of volume.
The request was the same as in the previous post of this thread, almost word for word: "Give us next year if we change nothing, so we can see what the new customers need to fill."
The difference is that here the honest answer was that the file, as it stood, could not give them that.
What the file looked like
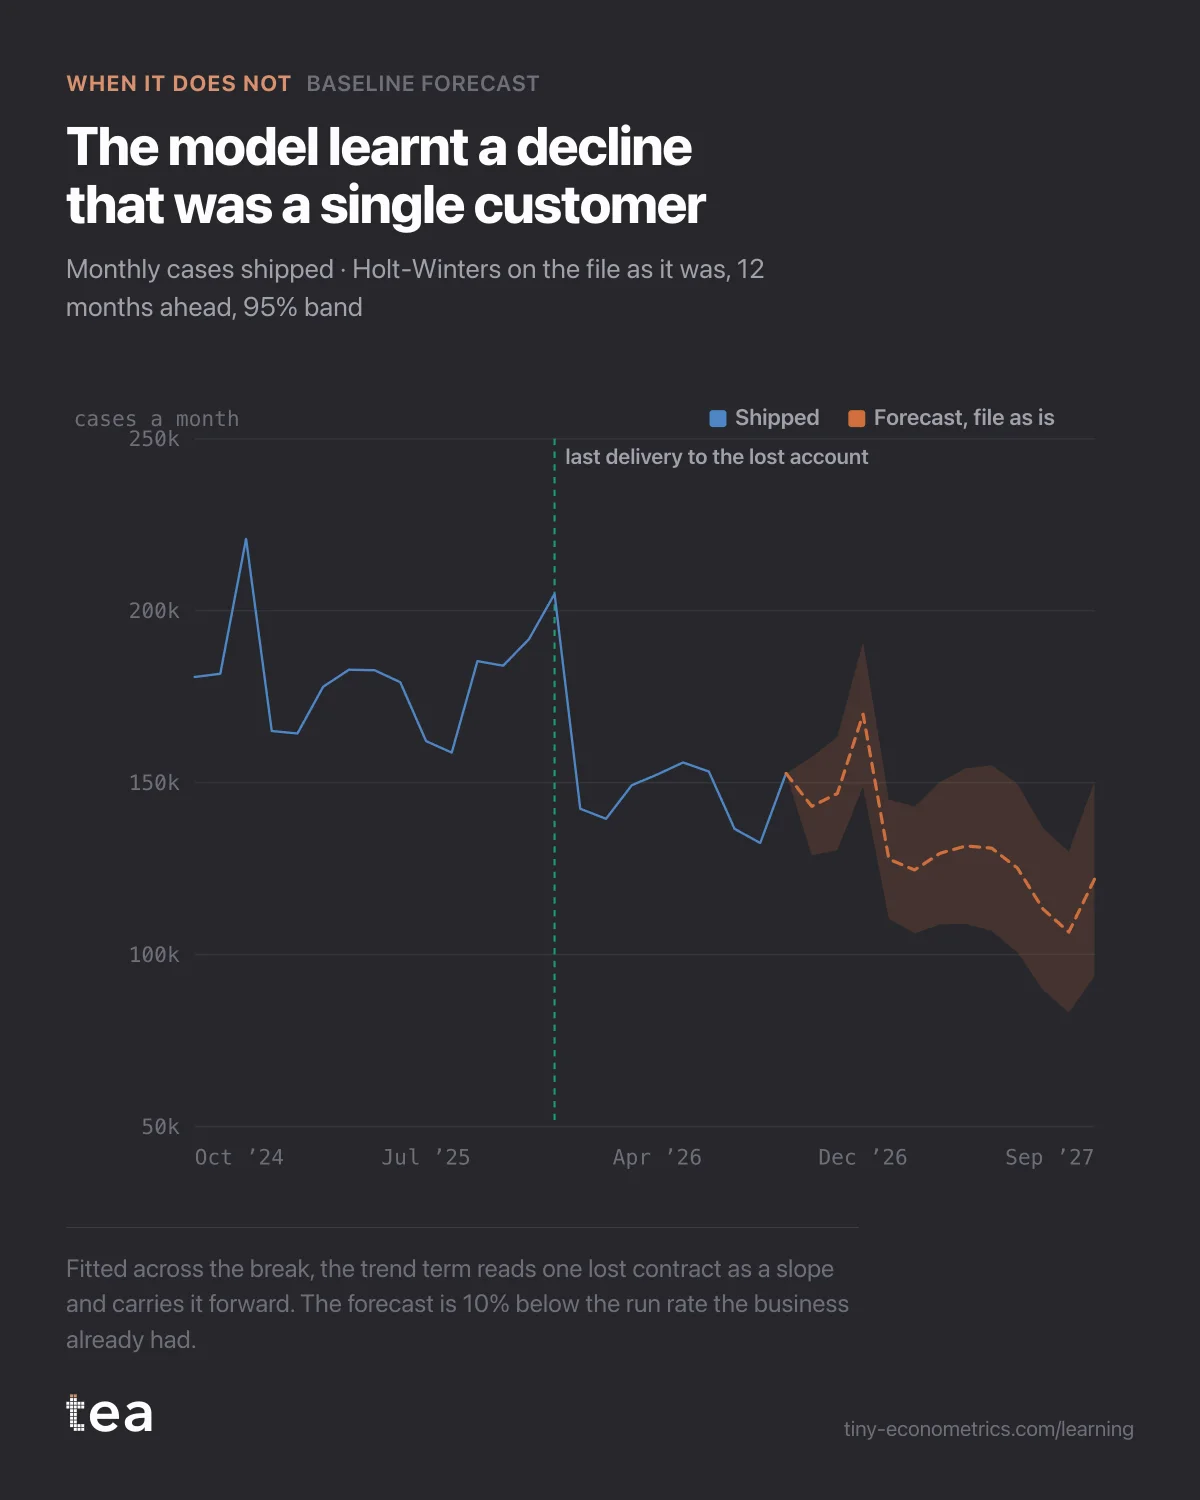
104 weekly rows, October 2024 to September 2026, one column: total cases shipped. Before the break, about 180,000 cases a month; after it, about 146,000. A clean step, visible to anybody who looked at the chart for two seconds.
Two things were not in the file. There was no column saying which customer the cases went to, so the loss was invisible to any model reading it. And there were only 38 weeks after the break, less than one full year, so the business that remained had never been observed through a Christmas.
What the baseline did, and why it is wrong
Baseline Forecast fits Holt-Winters: a level, a trend and a 52-week season, smoothed so that recent weeks weigh more. It is a good tool for a business that behaves next year roughly as it did in the last two. This one had been two businesses in two years.
Fed the file as it was, the model did exactly what it is built to do. It saw the level fall by a fifth in a few weeks and had two ways to explain it: a level shift or a trend. Exponential smoothing does not know the difference between "a customer left" and "demand is eroding", so part of the drop went into the trend term, and the trend term is projected forward. The forecast kept falling, month after month, and landed next year at 1.57M cases: about 10% below the 1.75M the business was already running at since January.
The season was wrong as well. The Christmas peak in the forecast had been learnt mostly from December 2024, when the discounter was still a customer and ordered heavily for the holidays. The model was projecting someone else's Christmas.
And the 95% interval was wide, which might look like honesty. It was not the right kind. An interval describes the noise the model saw around its own story. When the story is wrong, a wide band around it does not make it right; it only makes it harder to argue with.
What would have gone wrong if forced
Planning on 1.57M would have set the target for new customers about 180,000 cases too high, because the gap would include a decline that was never happening. Sales would have been chasing volume to fill a hole partly made of arithmetic. Worse, next year the business would beat its baseline comfortably and conclude the new accounts had performed, when most of the "beat" was the forecast's own mistake.
The opposite shortcut is no better. Fitting only the 38 weeks after the break gives a model with no season at all, because it has never seen a December without the discounter. It would plan Christmas production on an average week.
What to do instead
The fix was not in the model. It was in the file.
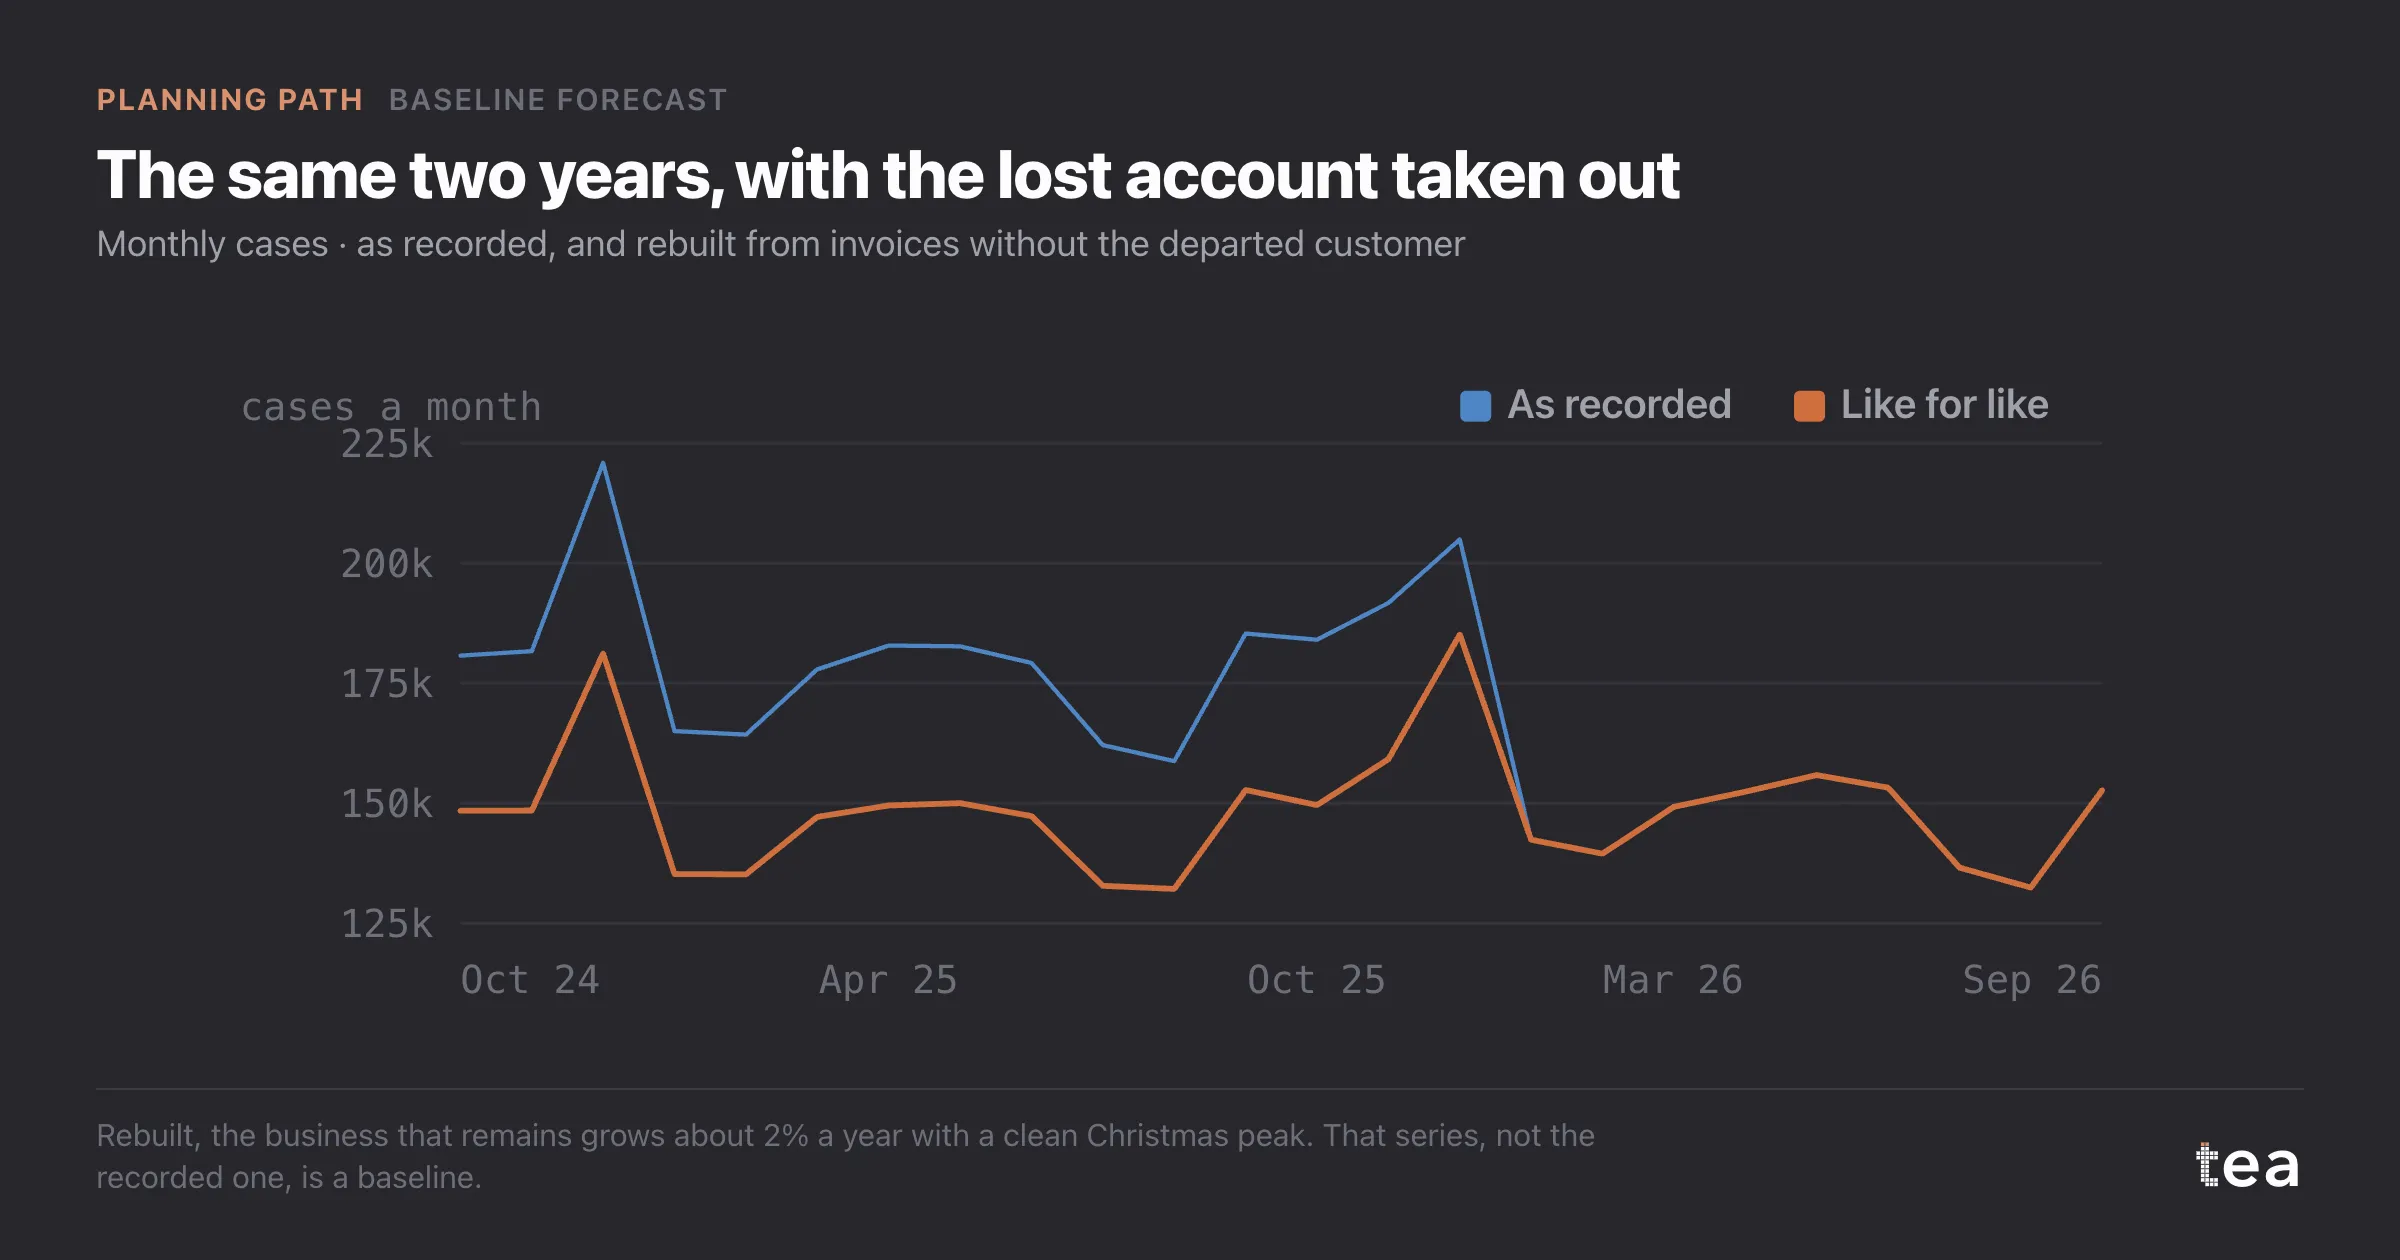
- Rebuild the series like for like. The invoicing system knew exactly what the discounter had bought each week. Subtracting it from all 104 weeks produced the history of the business that still exists, with two full Christmases in it. Rebuilt, that business grows about 2% a year, with a clean December peak. That is a baseline.
- Run the baseline on the rebuilt series. Next year came out at 1.84M cases, up about 2% on the like-for-like history, with an interval of a few per cent either side. Not exciting. Correct, as far as two years can say.
- Plan the replacement separately. New accounts go on top, as their own line, with their own uncertainty. They are a sales decision, not part of business as usual.
When the shock cannot be removed so neatly, say a factory fire that stopped production for six weeks, the options are similar: replace the lost weeks with an estimate and say so, or move to Time Series and model the shock explicitly with a dummy, which works only if there are enough weeks on both sides of it. If neither is possible, the honest baseline is a judgement written down with its reasons, and refitted once a full post-shock year exists.
The lesson
A baseline extrapolates the past, so it inherits whatever the past contains. If the history includes an event that will not repeat, the model will carry it forward as if it were the business. Before asking what next year looks like if nothing changes, check that the last two years were the same business. If they were not, rebuild the history first: no forecasting method can do that step for you.
The Planning Path
- A baseline forecast for the budget: 3% of the 8% was already coming
- When the past is not a baseline: forecasting after a lost account
- Three-year forecast from 26 months of data: say the horizon out loud (out October 9, 2026)
- Weekly demand forecasting with ARIMA: setting stock on the interval (out October 14, 2026)
- Measuring a one-off event: why one sponsorship cannot be isolated (out October 19, 2026)
- Seasonal indices with a weather control: stop planning on last March (out October 24, 2026)
- Doubling media spend in a scenario: what a simulator cannot know (out October 29, 2026)