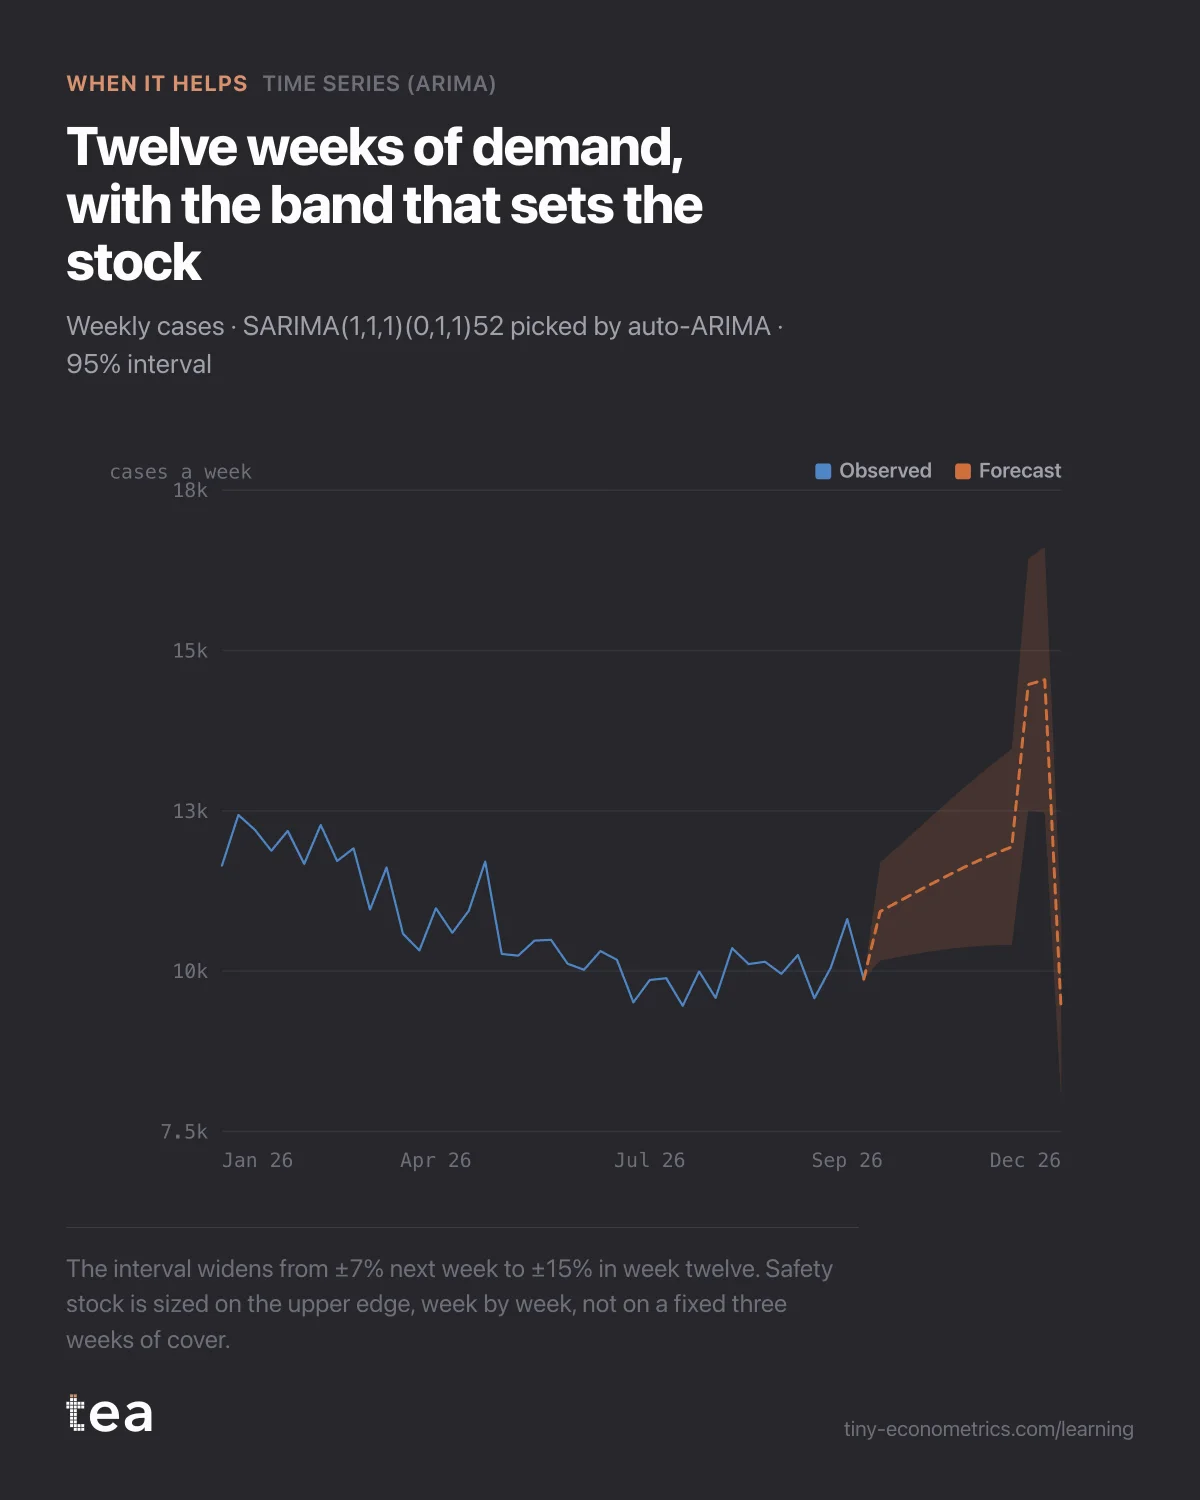
Dutch and Flemish foodservice distributor of frozen bakery, 182 weeks of cases shipped, asked how much safety stock the Christmas quarter needs.
A composite case, built from the kind of file we see most weeks. A foodservice distributor of frozen bakery products in the Netherlands and Flanders, delivering to about 1,900 cafés, hotels and canteens. Around 10,800 cases go out in an average week, at a stock cost of about €38 a case.
The question came from the supply-chain manager: "We order to last year's same week plus 6%, and we keep three weeks of safety stock because nobody trusts the plus 6%. Can a forecast tell us how much stock we actually need for October to Christmas?"
It is a good question for a forecast, because it is short-term, it repeats every week, and the cost of being wrong is visible in the warehouse.
What the file looked like
182 weekly rows, April 2023 to early October 2026, one column of cases shipped. Three and a half years: three full Christmases, three summers, three Easters. A gentle upward trend of about 3% a year, a summer dip when canteens close, a sharp rise in the first three weeks of December and an equally sharp drop over the holiday closure.
Nothing else was needed for this question. Prices barely moved, and the distributor does no media worth modelling. That simplicity is part of why it worked.
What the analysis did
Time Series runs auto-ARIMA across 96 candidate specifications, 32 short-memory orders under three seasonal ones, and keeps the one with the lowest AIC. It chose a SARIMA(1,1,1)(0,1,0)52: one difference to remove the trend, one seasonal difference to compare each week with the same week a year earlier, and short memory terms to absorb the week-to-week momentum. The page shows the winner only, so we refitted the order next to it, with one more autoregressive term, by name. It scored almost the same, which is useful: when two specifications tie, their forecasts should agree, and here they did, within 1% over twelve weeks.
Then the checks that decide whether the interval can be trusted. The autocorrelation of the residuals had one lag out of twenty just outside the 95% band, which is what chance alone produces. The Ljung-Box test, which asks the same question in one number, gave a p-value of 0.38: no pattern left on the floor. The residuals were roughly symmetric, with no growing spread over time.
That matters more than the line. A forecast interval is computed as if the residuals were noise. If they are not, the band is too narrow, and a too narrow band is exactly the thing that empties a warehouse in the week before Christmas.
The forecast itself: about 11,000 cases a week through October and November, rising to about 14,500 in the two weeks before Christmas, then falling to 9,400 in the closure week. The 95% interval was plus or minus 7% next week, widening to plus or minus 15% by week twelve.
The backtest that earned trust
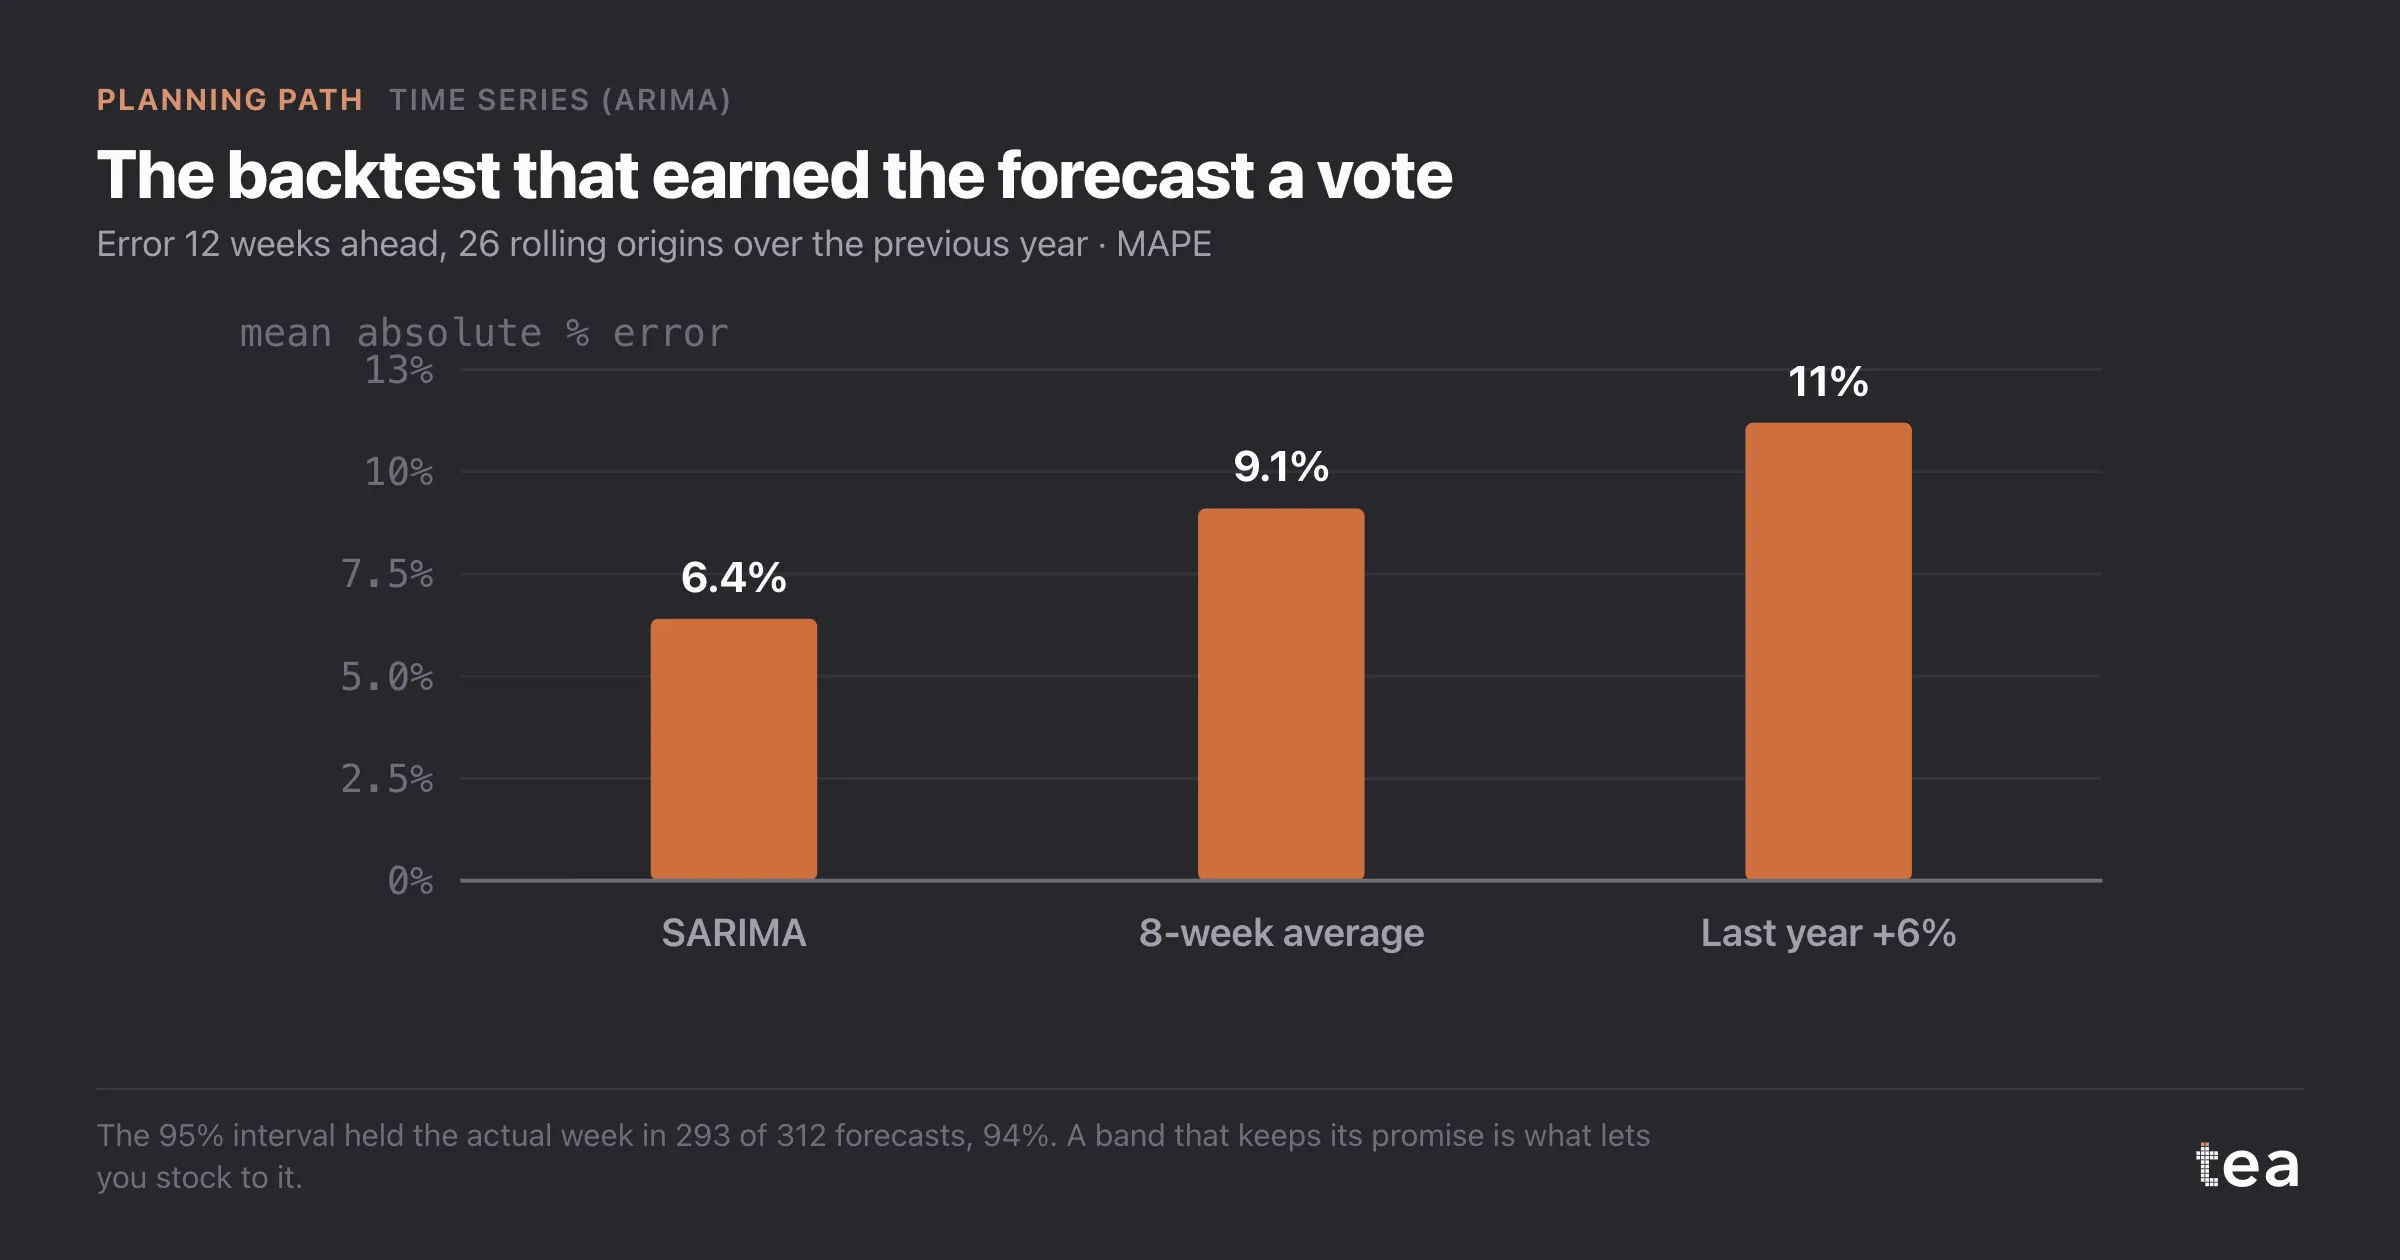
Nobody in supply chain changes a safety-stock rule because a model has a good AIC. So we replayed the previous year. Twenty-six times, from a different starting week, the model was fitted only on the data available at that point and asked for the next twelve weeks. Then each forecast was compared with what actually shipped.
- SARIMA, twelve weeks ahead: 6.4% average absolute error.
- An eight-week moving average: 9.1%.
- The existing rule, last year's same week plus 6%: 11.2%.
And the more important number: out of 312 forecast weeks, the 95% interval contained the actual week 293 times, 94%. The band was keeping its promise. That is what allows you to order to it.
The verdict: it helps, and it freed about €450k
The new rule sets each week's order so that stock covers the upper edge of the 90% interval for the lead time, instead of a flat three weeks of cover on top of a guess. Averaged over the quarter, that came to 1.9 weeks of cover, with more in December, where the band is widest, and less in October.
1.1 weeks of cover less, on about 10,800 cases a week at €38 a case, is roughly €450k of working capital no longer sitting in a freezer. The rule had already been trialled on the summer quarter, with no more stock-outs than the same quarter a year earlier, which is the check that matters: the saving did not come out of service. Christmas is its first hard test, and it goes in sized the same way.
Two cautions travel with it. The model knows the calendar of the past; it will not anticipate a new hotel chain signing up or a canteen contract ending, and those are flagged by sales and added by hand. And the interval at week twelve is twice as wide as at week one, so orders placed far ahead still carry real buffer. That is not a flaw, it is the model reporting the horizon honestly, which a short history cannot do as well.
The lesson
The forecast line is not what changes a stock decision. The interval is, and only once it has been shown to hold. Fit, check the residuals, then replay a year and count how often the band was right. If it was, size the stock to the band. If it was not, no amount of decimal precision on the central line should move a single pallet.
tea, the product
Your file, this question
Fifteen analyses on a CSV of weekly data, with the intervals and the diagnostics shown, and a plain sentence when the data cannot answer. Free while in beta, by invitation.
Request a place in the beta→tea, the product
Fifteen econometric analyses on your own CSV: Time Series (ARIMA), saturation curves, elasticities, budget allocation. Intervals and diagnostics shown, and a plain sentence when the file cannot answer.
Free while in beta, by invitation.
Request a place in the beta →Liked this? Run it on your own data.
tea runs Time Series (ARIMA) and fourteen other analyses on any weekly CSV, in minutes. Free while in beta, by invitation.
The Planning Story
- A baseline forecast for the budget: 3% of the 8% was already coming
- When the past is not a baseline: forecasting after a lost account
- Three-year forecast from 26 months of data: say the horizon out loud
- Weekly demand forecasting with ARIMA: setting stock on the interval
- Measuring a one-off event: why one sponsorship cannot be isolated (out October 19, 2026)
- Seasonal indices with a weather control: stop planning on last March (out October 24, 2026)
- Doubling media spend in a scenario: what a simulator cannot know (out October 29, 2026)