Thread · Discovery Story

Something moved. What moved it?

You have a number that went up or down and five theories about why. Four analyses, in the only order that does not let one driver take credit for another. The path runs Trend Analysis, Seasonality & Event Impact, Contribution & Driver Decomposition, Base vs Incremental.

Here, one case per post, in reading order: where each step changed a decision, and where the file could not answer.

Trend analysis with a structural break, and why one line lies
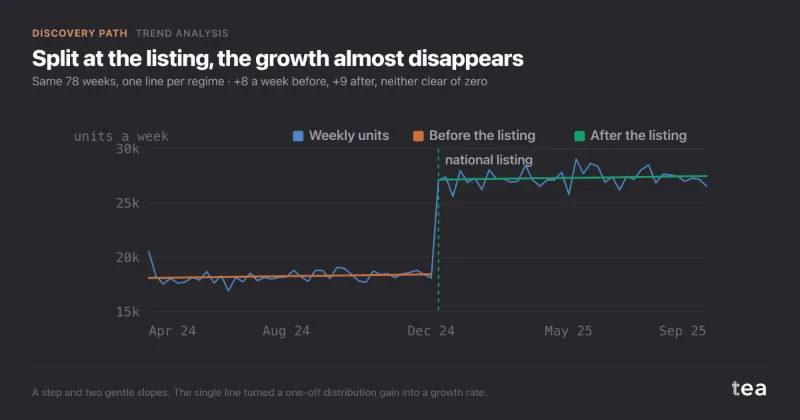
UK premium crisps brand, 78 weeks of retail units, asked whether next year can be planned on its growth rate.

A composite case, built from the kind of file we see most weeks. A premium crisps brand in the UK, about £2.5M a year at retail, with a small commercial team and a forecast due for the annual plan.

Continue reading →

Filed under Trend Analysis  |  Discovery Story  |  Permalink
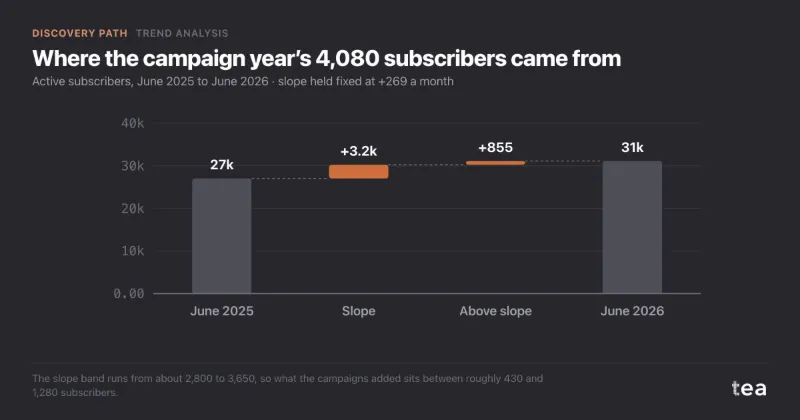
Subscription growth from marketing, or a slope already there

Coffee subscription business in the Netherlands and Belgium, 36 months of active subscribers, asked whether doubling campaign spend doubles growth.

A composite case, built from the kind of file we see most weeks. A coffee subscription business selling in the Netherlands and Belgium, around 31,000 active subscribers, a monthly box, and a first year of paid campaigns behind it.

Continue reading →

Filed under Trend Analysis  |  Discovery Story  |  Permalink
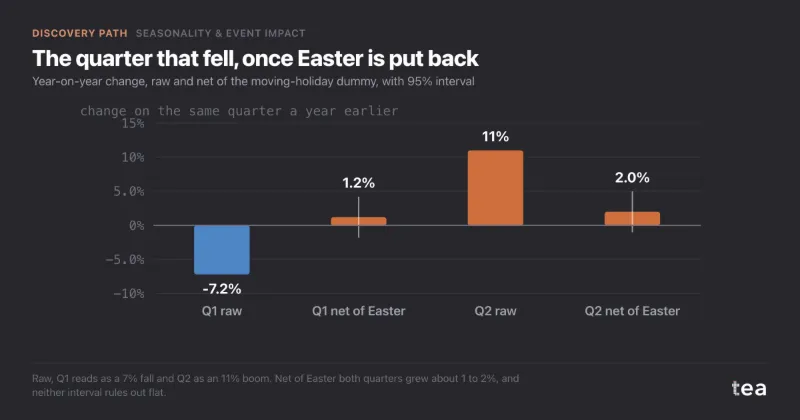
Easter, year-on-year comparisons and the quarter that did not fall

Italian confectionery brand, 182 weeks of revenue, asked whether a new packaging caused a 7% fall in Q1.

A composite case, built from the kind of file we see most weeks. An Italian confectionery brand, chocolate eggs and colomba in spring, biscuits the rest of the year, about €22M of revenue through grocery.

Continue reading →

Filed under Seasonality & Event Impact  |  Discovery Story  |  Permalink

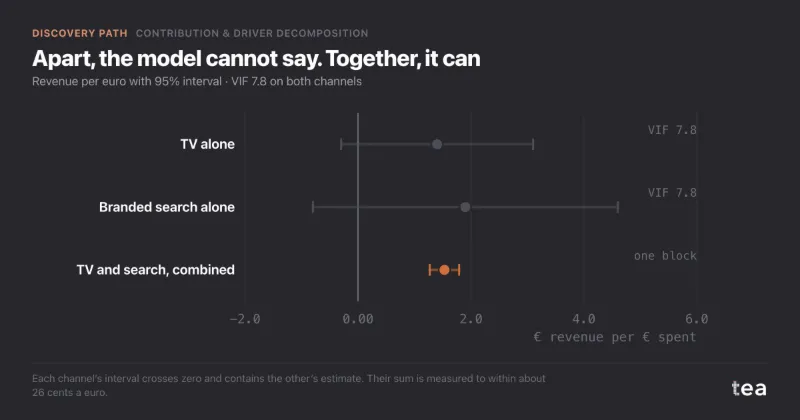
When TV and branded search collinearity defeats the regression

French direct-to-consumer mattress brand, 104 weeks of sales and media, asked how much revenue comes from TV and how much from branded search.

A composite case, built from the kind of file we see most weeks. A direct-to-consumer mattress brand in France, around €31M of online revenue, with a TV agency and a search agency who each had a slide explaining that the year belonged to them.

Continue reading →

Filed under Contribution & Driver Decomposition  |  Discovery Story  |  Permalink

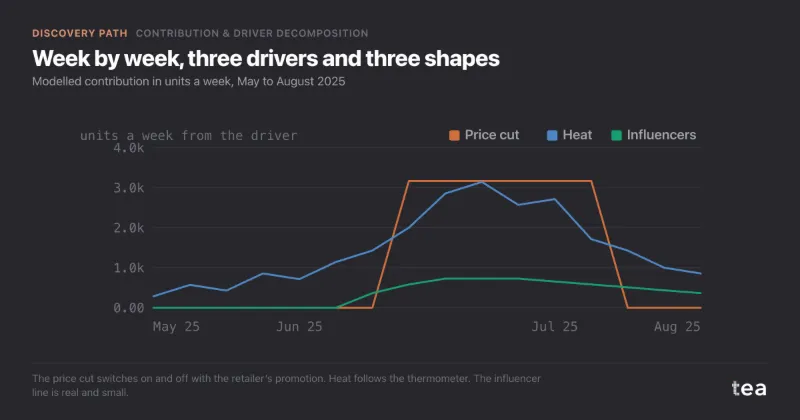
A sales spike credited to influencers, decomposed by driver

UK iced coffee brand, 130 weeks of units, asked whether a summer sales spike justifies tripling a new influencer programme.

A composite case, built from the kind of file we see most weeks. A UK brand of ready-to-drink iced coffee, sold through grocery and convenience, around £14M at retail.

Continue reading →

Filed under Contribution & Driver Decomposition  |  Discovery Story  |  Permalink

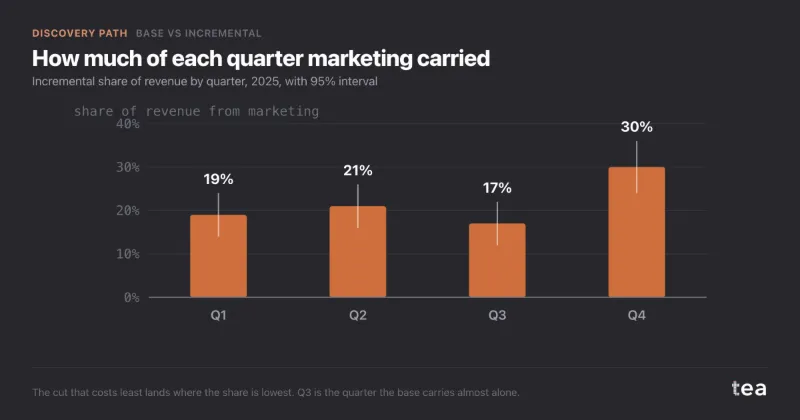
What would revenue be with zero marketing? The counterfactual year

Nordic outdoor apparel retailer, €38M online revenue, 156 weeks of data, the CFO asked what last year would have been without marketing.

A composite case, built from the kind of file we see most weeks. An outdoor apparel retailer selling online in Sweden, Norway and Finland, €38.0M of revenue in 2025 and €3.1M of marketing behind it.

Continue reading →

Filed under Base vs Incremental  |  Discovery Story  |  Permalink

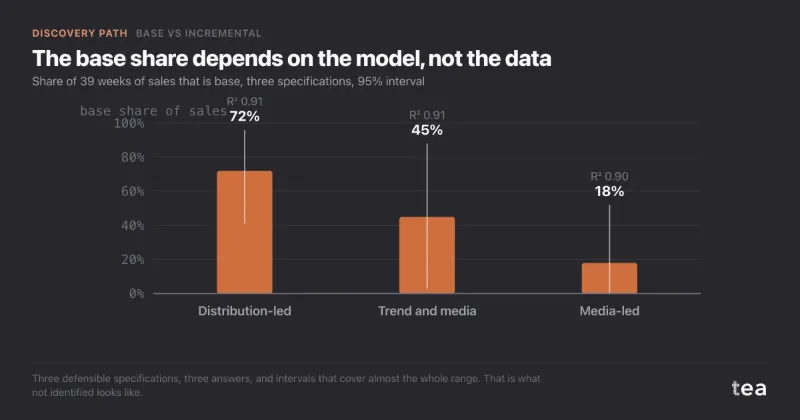
Base vs incremental after a launch, with no base in the data

German plant-based protein drink, 39 weeks since launch, media every week, the board asked how much would sell without advertising.

A composite case, built from the kind of file we see most weeks. A plant-based protein drink launched in Germany on 5 January 2026, sold through grocery and drugstores, with a launch budget that ran from the first week.

Continue reading →

Filed under Base vs Incremental  |  Discovery Story  |  Permalink