Archive for the category

Lag & Carryover

How long a euro of media keeps working after the week it ran. Adstock, half-life and the distribution of an effect over time, and the files where it cannot be identified. How to read it, and where it misleads.

A step of the Media Effectiveness Story.

Planning by channel half-life: adstock decay in the media plan
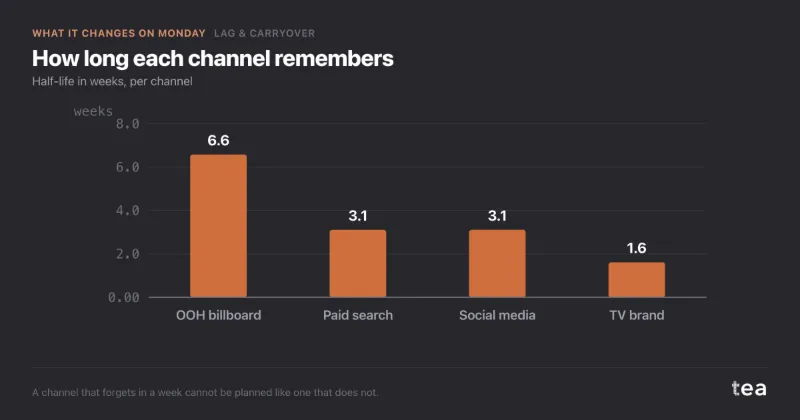
Four channels, four memories. Outdoor 6.6 weeks, social 3.1, paid search 3.1, TV brand 1.6.

One plan, one reporting cycle, one set of rules for all four. That is the mismatch this chart exists to end.

Continue reading →

Filed under Lag & Carryover  |  Permalink
Geometric adstock explained: where a euro of outdoor actually lands

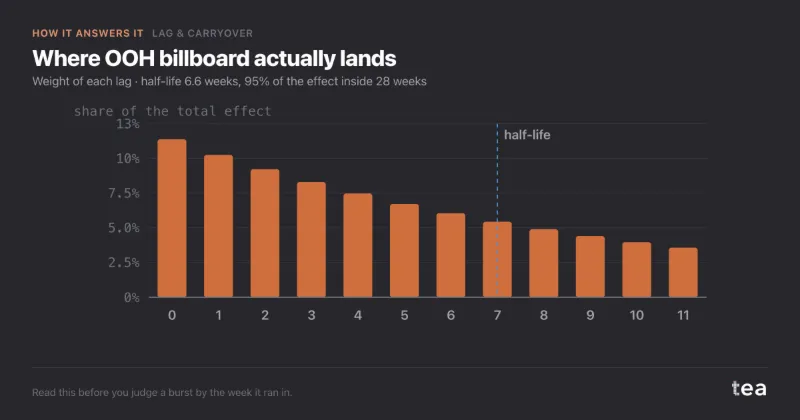
Where does a euro of outdoor actually land? Not in the week it ran, and this is the distribution.

Each bar is the share of the total effect that arrives at that lag. Week zero takes 13%. The rest is spread over the weeks after it, with a half-life of 6.6 weeks and 95% of the effect inside 28.

Continue reading →

Filed under Lag & Carryover  |  Permalink
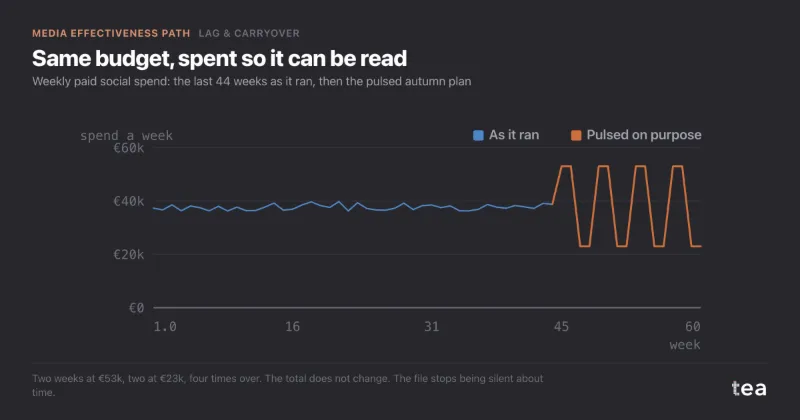
Why flat always-on spend makes carryover impossible to measure

Online home-insurance broker in Spain, always-on paid social at about €38k a week, asking what an August pause would cost.

A composite case, built from the kind of file we see most weeks. An online home-insurance broker in Spain, selling direct, with paid social as its largest channel. Spend had sat at about €38k a week for seventy weeks. Leads, meaning quote requests, ran at around 4,200 a week.

Continue reading →

Filed under Lag & Carryover  |  Media Effectiveness Story  |  Permalink

Adstock and the outdoor burst that was judged on the wrong week

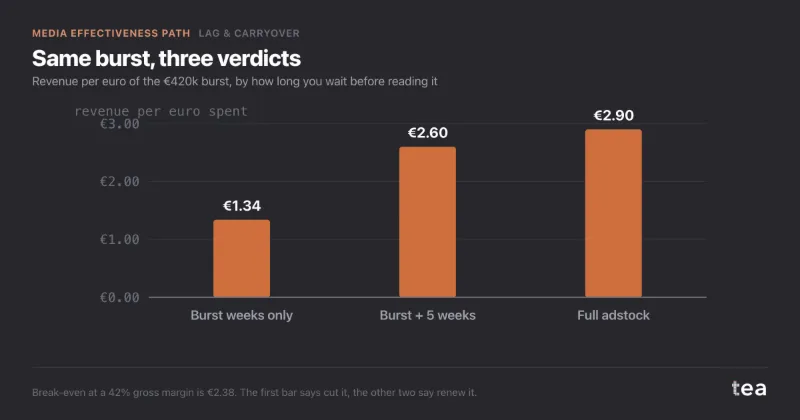
Home-furnishing retailer, 38 stores in northern Italy, asking whether a spring outdoor and radio burst had failed.

A composite case, built from the kind of file we see most weeks. A home-furnishing retailer with 38 stores across northern Italy, roughly €1.9M of revenue in an ordinary week, and a marketing team that had just been told its spring burst did not work.

Continue reading →

Filed under Lag & Carryover  |  Media Effectiveness Story  |  Permalink

Adstock and carryover: how long a media euro keeps working

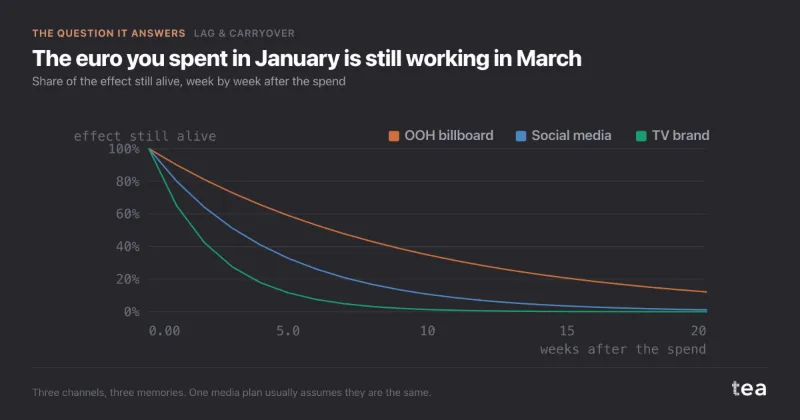
The euro you spent in January is still working in March. That is not a slogan, it is a measurable quantity, and this chart is what it looks like.

Three channels from two years of weekly data. Each curve is the share of a channel's effect still alive, week by week after the money left.

Continue reading →

Filed under Lag & Carryover  |  Permalink