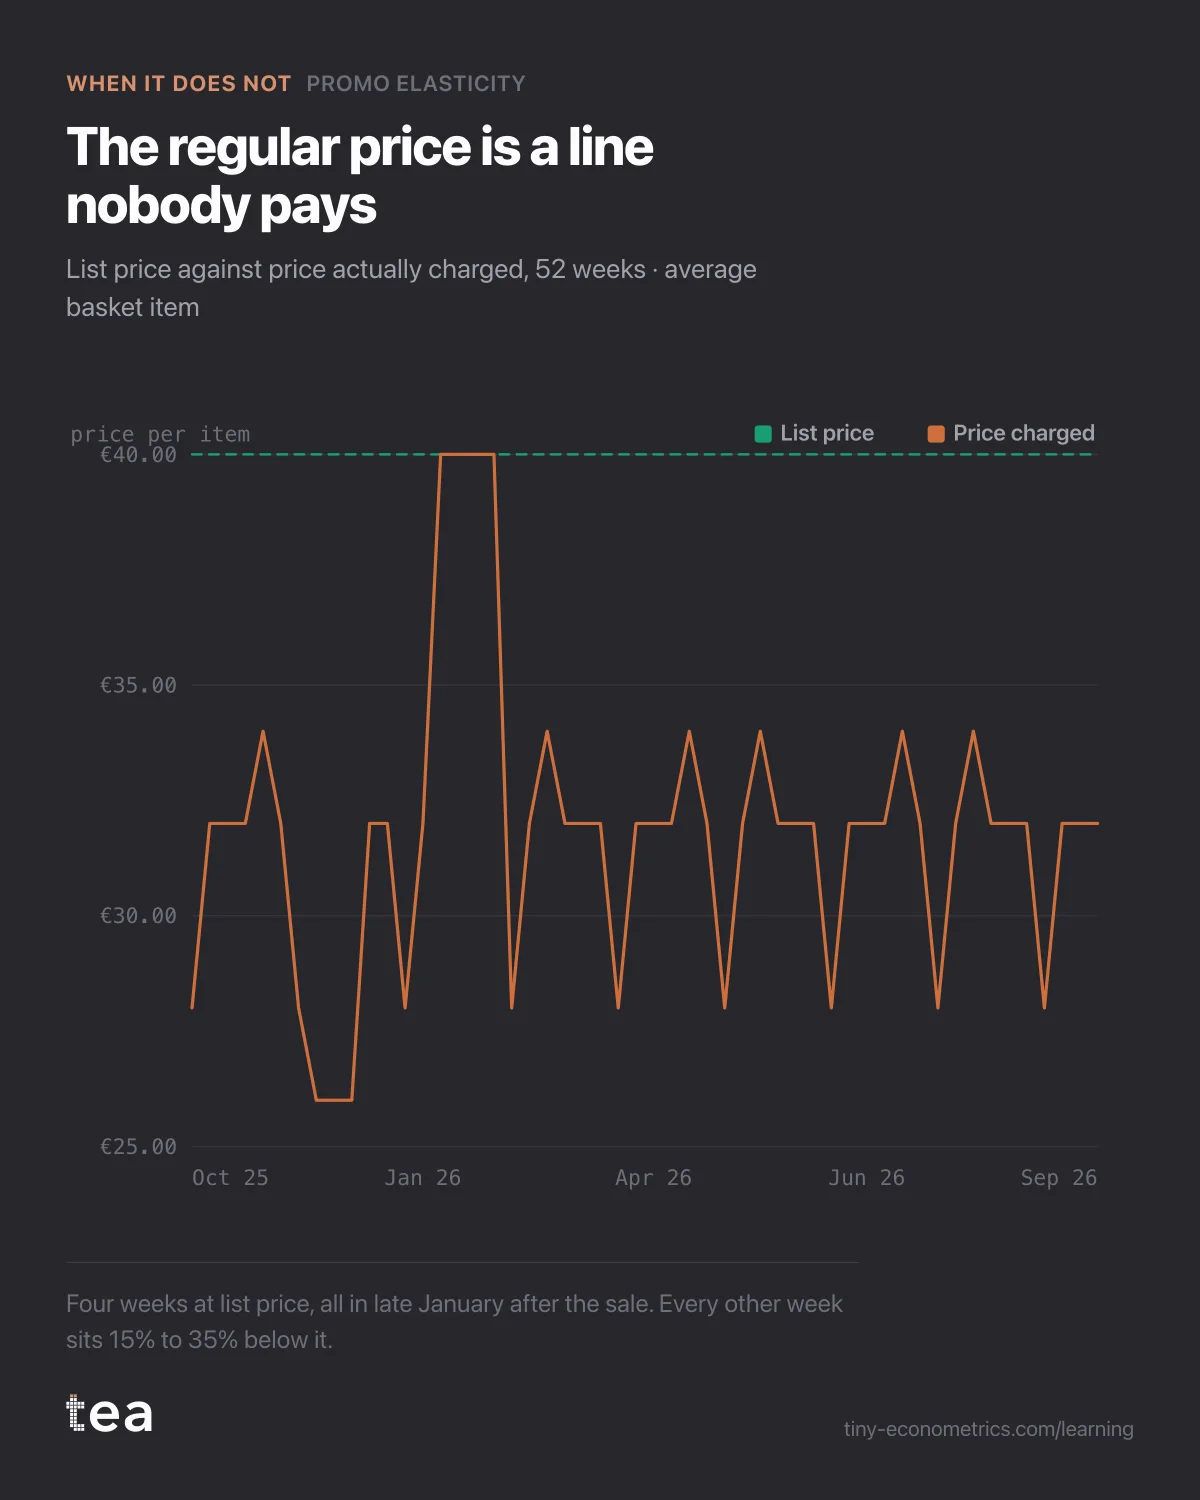
Online homeware retailer in Spain, about €14M a year, asking what its near-permanent sitewide discount actually buys.
A composite case, built from the kind of file we see most weeks. An online homeware retailer in Spain, about €14M of revenue a year, selling cushions, lamps, tableware and the like, with an average item list price of around €40. Its site had carried a sitewide discount for so long that nobody in the current team remembered starting it.
The new commercial director wanted to know what it was worth. Her question: "What does the discount actually buy us, and what happens if we turn it off?"
The previous post measured a promotion against the weeks around it. This file had almost no weeks around it.
What the file looked like
Three years of weekly data, 156 rows. Orders, revenue, average item price charged, the sitewide discount depth, paid media spend and email sends.
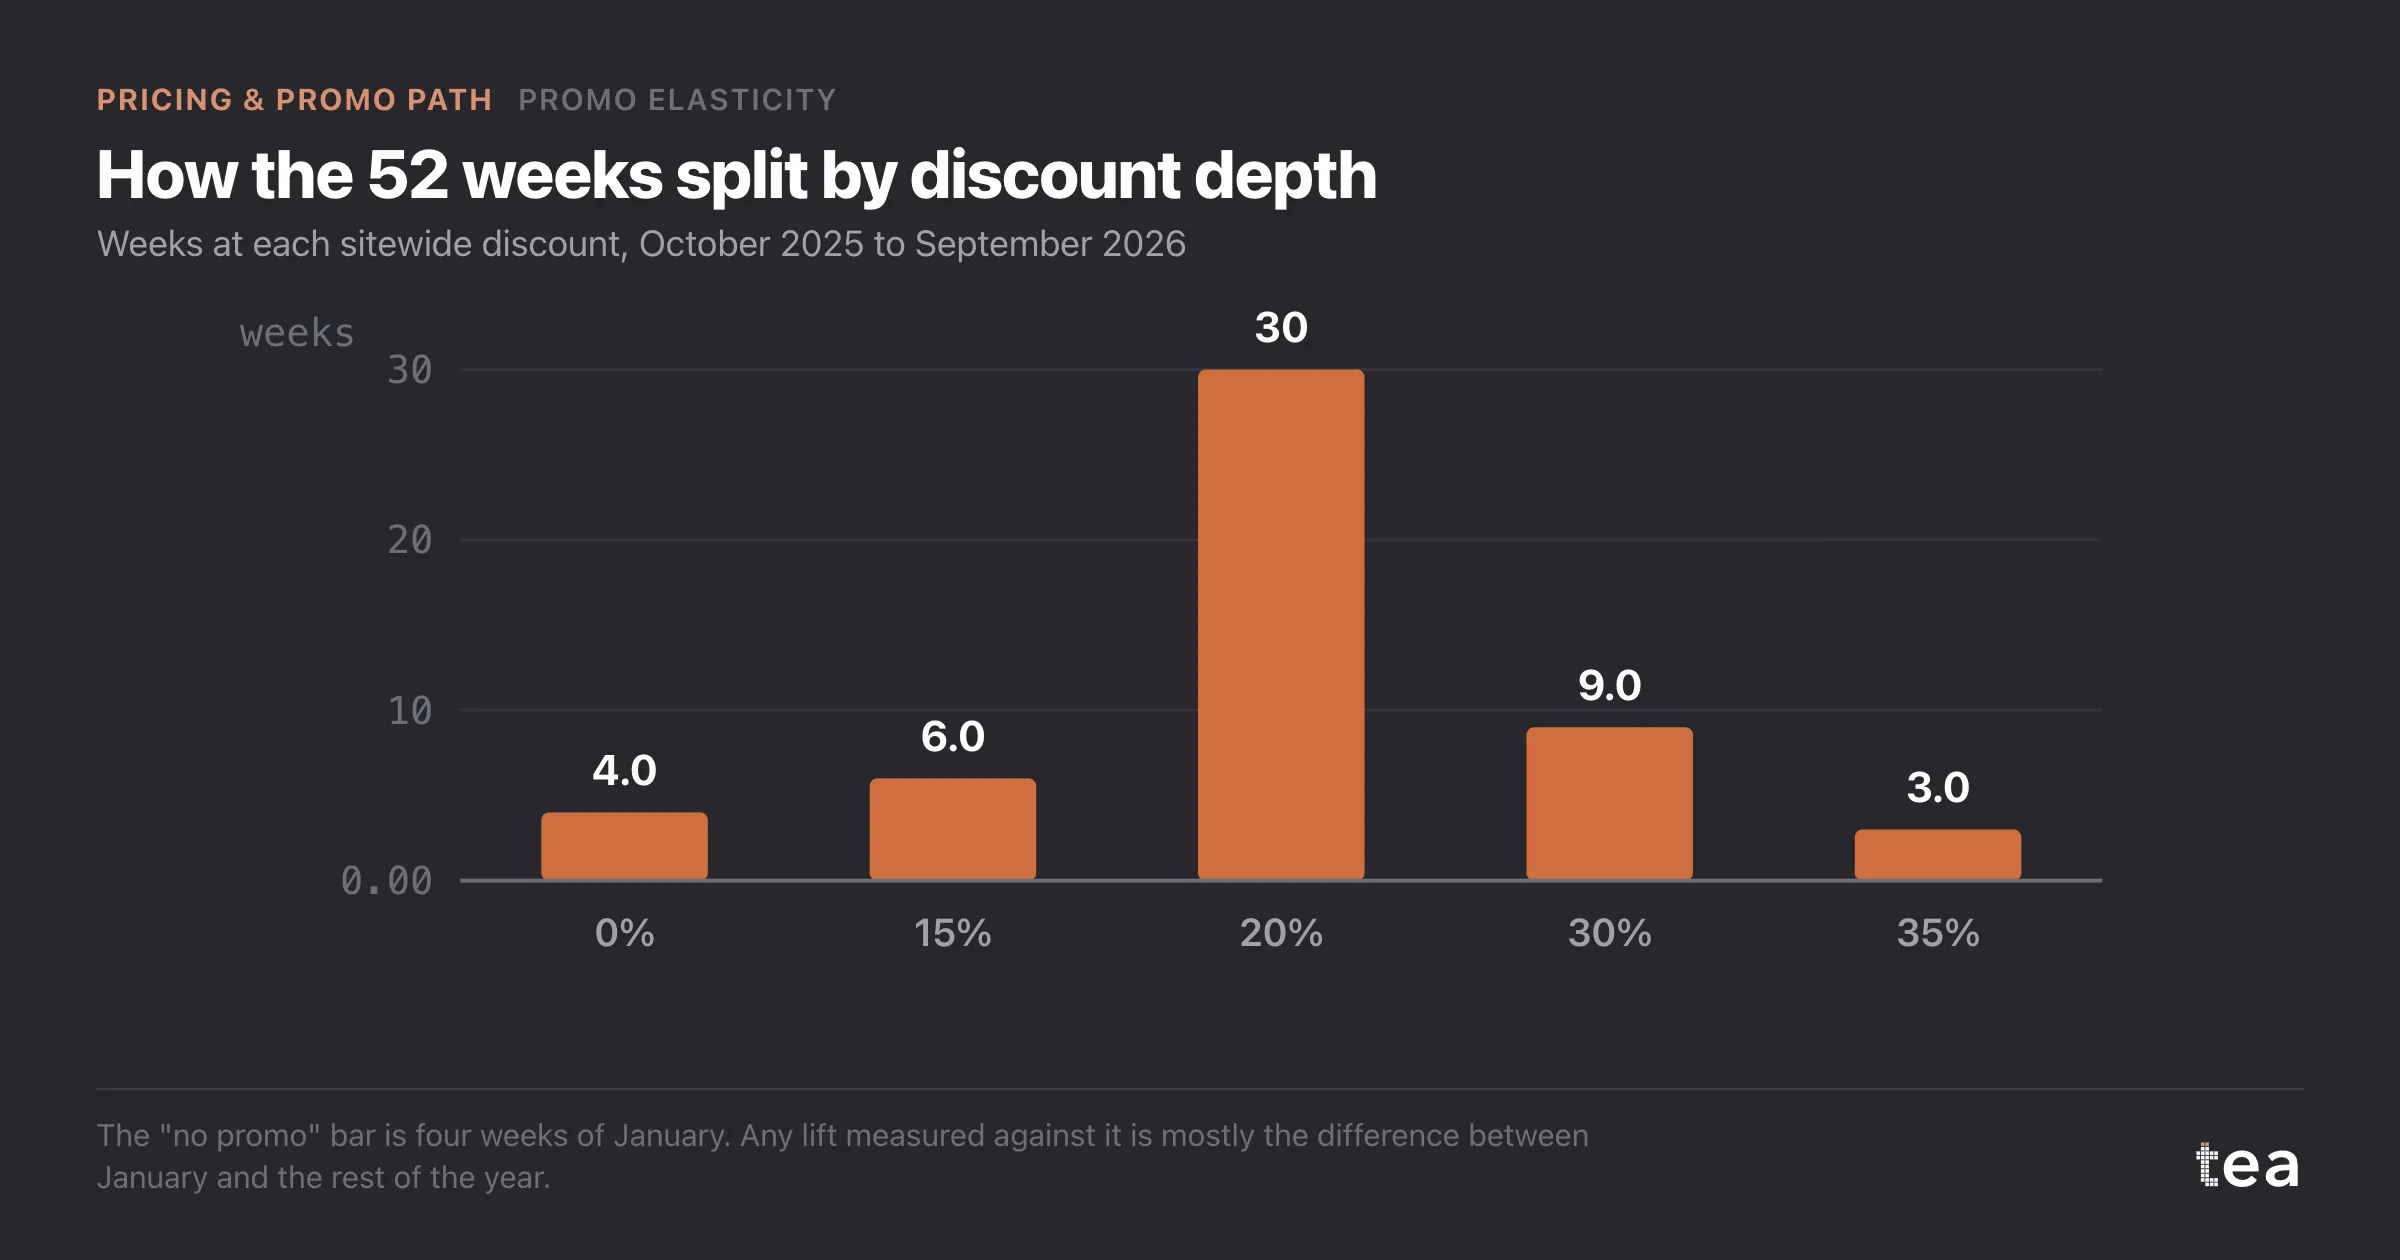
Of the 156 weeks, 144 carried a sitewide discount. In the most recent year the split was typical: 30 weeks at 20% off, 6 at 15%, 9 at 30%, 3 at 35% across Black Friday, and 4 at full price. Those 4 full-price weeks were the last fortnight of January and the first of February, after the winter sale ended and before the spring one began. The same was true in the two years before.
So the "regular price" of €40 was a price the site charged for four quiet weeks a year. Every other week, customers paid between €26 and €34.
Why promo elasticity cannot answer this
Promo Elasticity measures a promotion by comparing promoted weeks with the baseline the model builds from unpromoted weeks, with season and other drivers held to one side. The lift is the gap between the two. Everything rests on the unpromoted weeks being a fair picture of what a normal week looks like.
Here, the unpromoted weeks are not a normal week. They are the weakest weeks of the homeware calendar, after Christmas, when people have spent their money and are not buying lamps. Any lift measured against them is mostly the difference between late January and the rest of the year. The model cannot separate "no discount" from "January", because in this file they never happened apart.
The depth of the discount has the same problem from the other side. Deep discounts ran at Black Friday and before Christmas, the strongest weeks of the year, and paid media went up with them because the ads announced the sale. Depth, season and media spend rise and fall together. Collinearity means the model can see that something drives the peak but cannot say how much of it is the extra ten points of discount.
When we forced the fit, it produced a promotional lift of +118%, with a 95% interval from +20% to +260%. tea flags both problems on the result: too few unpromoted weeks, all in one season, and a high variance inflation factor between depth and media. A number with that interval is not an estimate. It is a range of opinions.
What would have gone wrong
Two decisions could have been taken on the forced number, and both are expensive.
Read +118% at face value and the conclusion is that the discount more than doubles sales, so it must stay forever. That may be roughly right, but the number did not show it. Read the low end and the conclusion is that it barely matters, so turn it off. That is a 25% effective price rise on the whole site, far outside any price the customers have seen in three years, and no model fitted on this file can say what happens there.
There is a deeper problem. Customers who have only ever seen the site at 20% off do not read €32 as a discount. They read it as the price. The €40 is a reference figure on the product page, not a price anyone pays. Turning the discount off is not ending a promotion. It is a price rise.
What to do instead
Stop asking the promotion question and ask the price question the file can answer.
- Treat the price charged as the price. The charged price did move, between about €26 and €34, as depth went from 35% to 15% in ordinary weeks. Price Elasticity on that column, with season and media as controls, can say what moving from 20% to 15% would do, because 15% has actually been tried outside the peak.
- Vary the depth on purpose in spring and early autumn, alternating 15% and 25% in fortnightly blocks, so depth stops moving with season.
- Test full price outside January. Two weeks at full price in May, ideally on one product family at a time, so the first unpromoted weeks that are not January enter the file.
After six months of that, the file has a question it can answer, and the Pricing & Promo path can be run properly.
The lesson
A promotion that never stops is not a promotion. It is the price, and the list price above it is a label. Promo elasticity needs normal weeks to compare against, and if you have none, the first job is not a model. It is creating a few, on purpose, in weeks where they mean something.
tea, the product
Your file, this question
Fifteen analyses on a CSV of weekly data, with the intervals and the diagnostics shown, and a plain sentence when the data cannot answer. Free while in beta, by invitation.
Request a place in the beta→tea, the product
Fifteen econometric analyses on your own CSV: Promo Elasticity, saturation curves, elasticities, budget allocation. Intervals and diagnostics shown, and a plain sentence when the file cannot answer.
Free while in beta, by invitation.
Request a place in the beta →Liked this? Run it on your own data.
tea runs Promo Elasticity and fourteen other analyses on any weekly CSV, in minutes. Free while in beta, by invitation.
The Pricing & Promo Story
- Price elasticity when your shelf price never moved in three years
- Price elasticity of -1.4 and why a 5% price rise still paid
- Promo lift net of pull-forward: the 30% discount that never paid
- Promo elasticity when you are on promotion 48 weeks a year
- Cross-price elasticity: which competitor actually takes your volume (out October 18, 2026)
- Cross-elasticity when competitor prices are only monthly (out October 23, 2026)
- Scenario simulation for a promo calendar: the wave worth dropping (out October 28, 2026)