Olive oil brand, one-litre bottles in Italian grocery, asking whether the brand leader or the private label is its real competitor.
A composite case, built from the kind of file we see most weeks. An olive oil brand selling one-litre bottles of extra virgin through Italian grocery, a solid number three in the category behind the brand leader and the retailers' private labels. Over the winter, olive oil costs pushed every shelf price up, and the brand found itself in a familiar argument.
Sales said the leader was the threat. Trade marketing said it was the private label, which had been taking share for years. The question that reached us: "Who is actually taking our volume when prices move, the leader or the private label?"
That is exactly the question Cross-Elasticity answers when the file allows it. The previous post in this thread is a case where it did. This file did not allow it.
What the file looked like
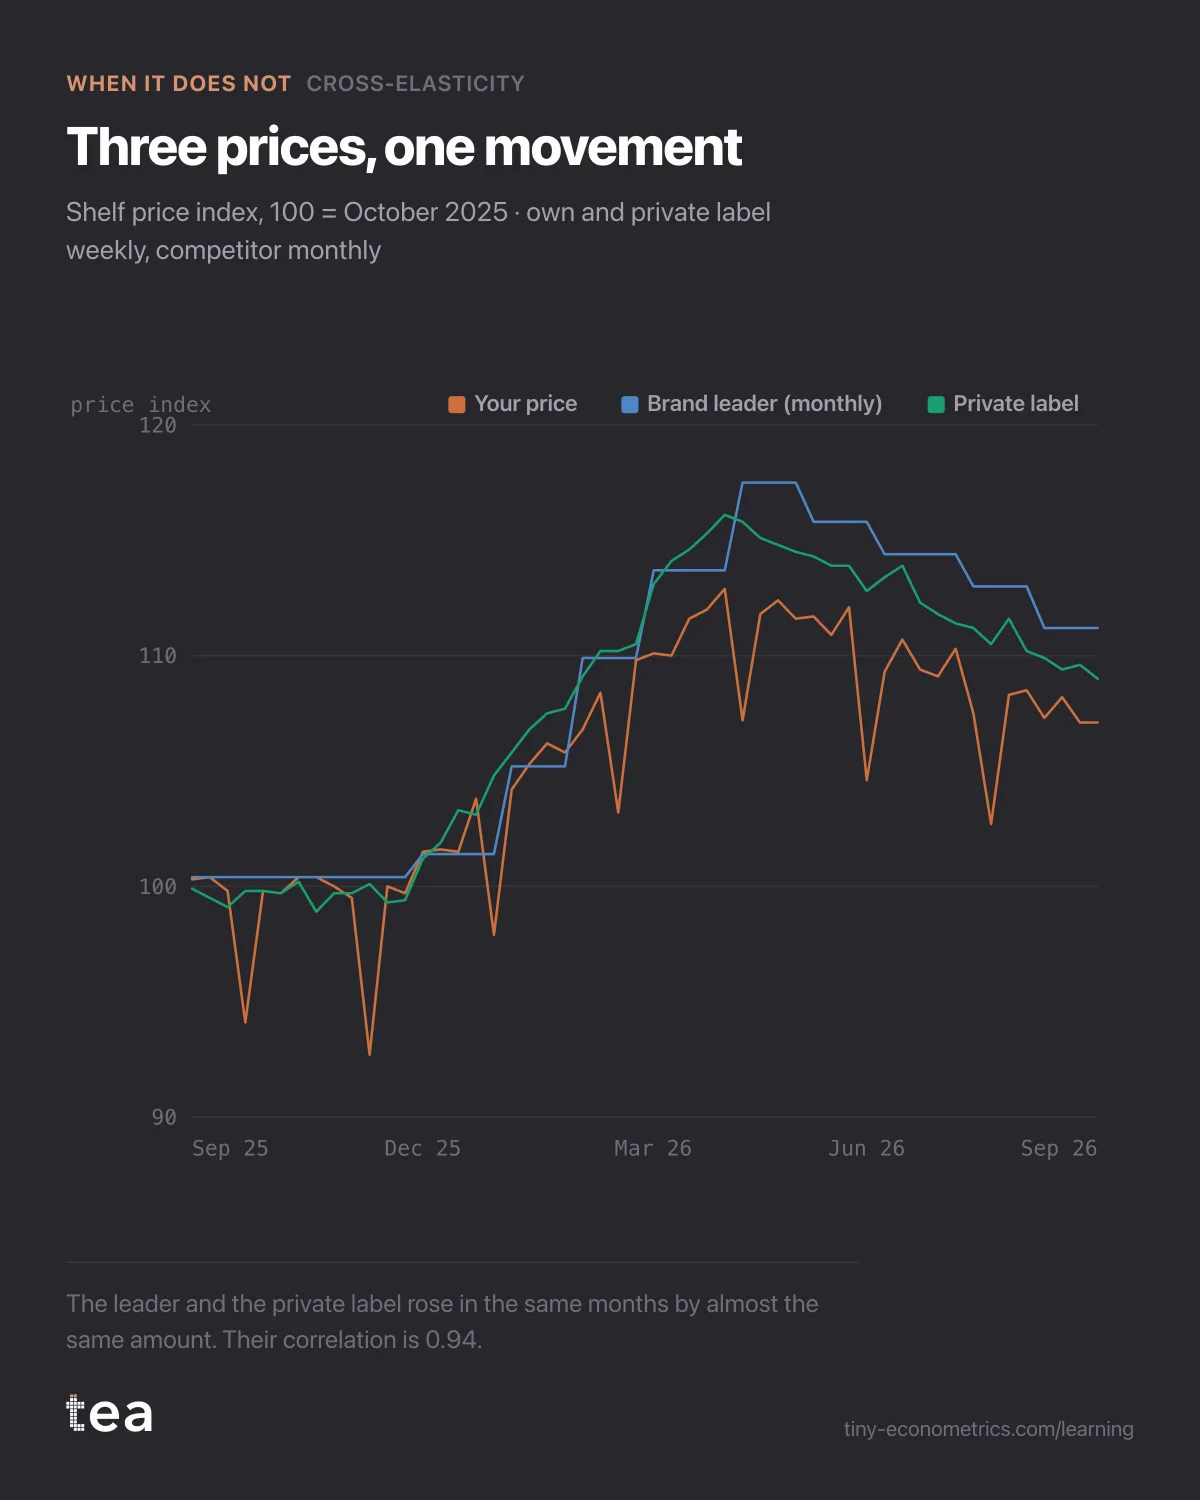
Two years of weekly data, 104 rows. Own units and own shelf price, weekly, from the brand's retail data. The private label's shelf price, weekly, from the same retailer portal. And the brand leader's price, which the brand did not get from any data provider. An agency scraped it from the retailers' websites on the first Monday of each month, so the file carried it as one value repeated for four or five weeks.
Then the winter. From December to April, the three prices rose together, with costs. The leader went up about 17%, the private label about 16%, the brand itself about 13%. They rose in the same months, by similar steps, and eased together through the summer. Over the two years, the leader's price and the private label's price were correlated at 0.94.
Why the maths cannot separate them
A cross-elasticity is estimated from weeks where one competitor's price moved and the other's did not. That is how the model tells which move your volume answered. On this file there were almost no such weeks, for two reasons.
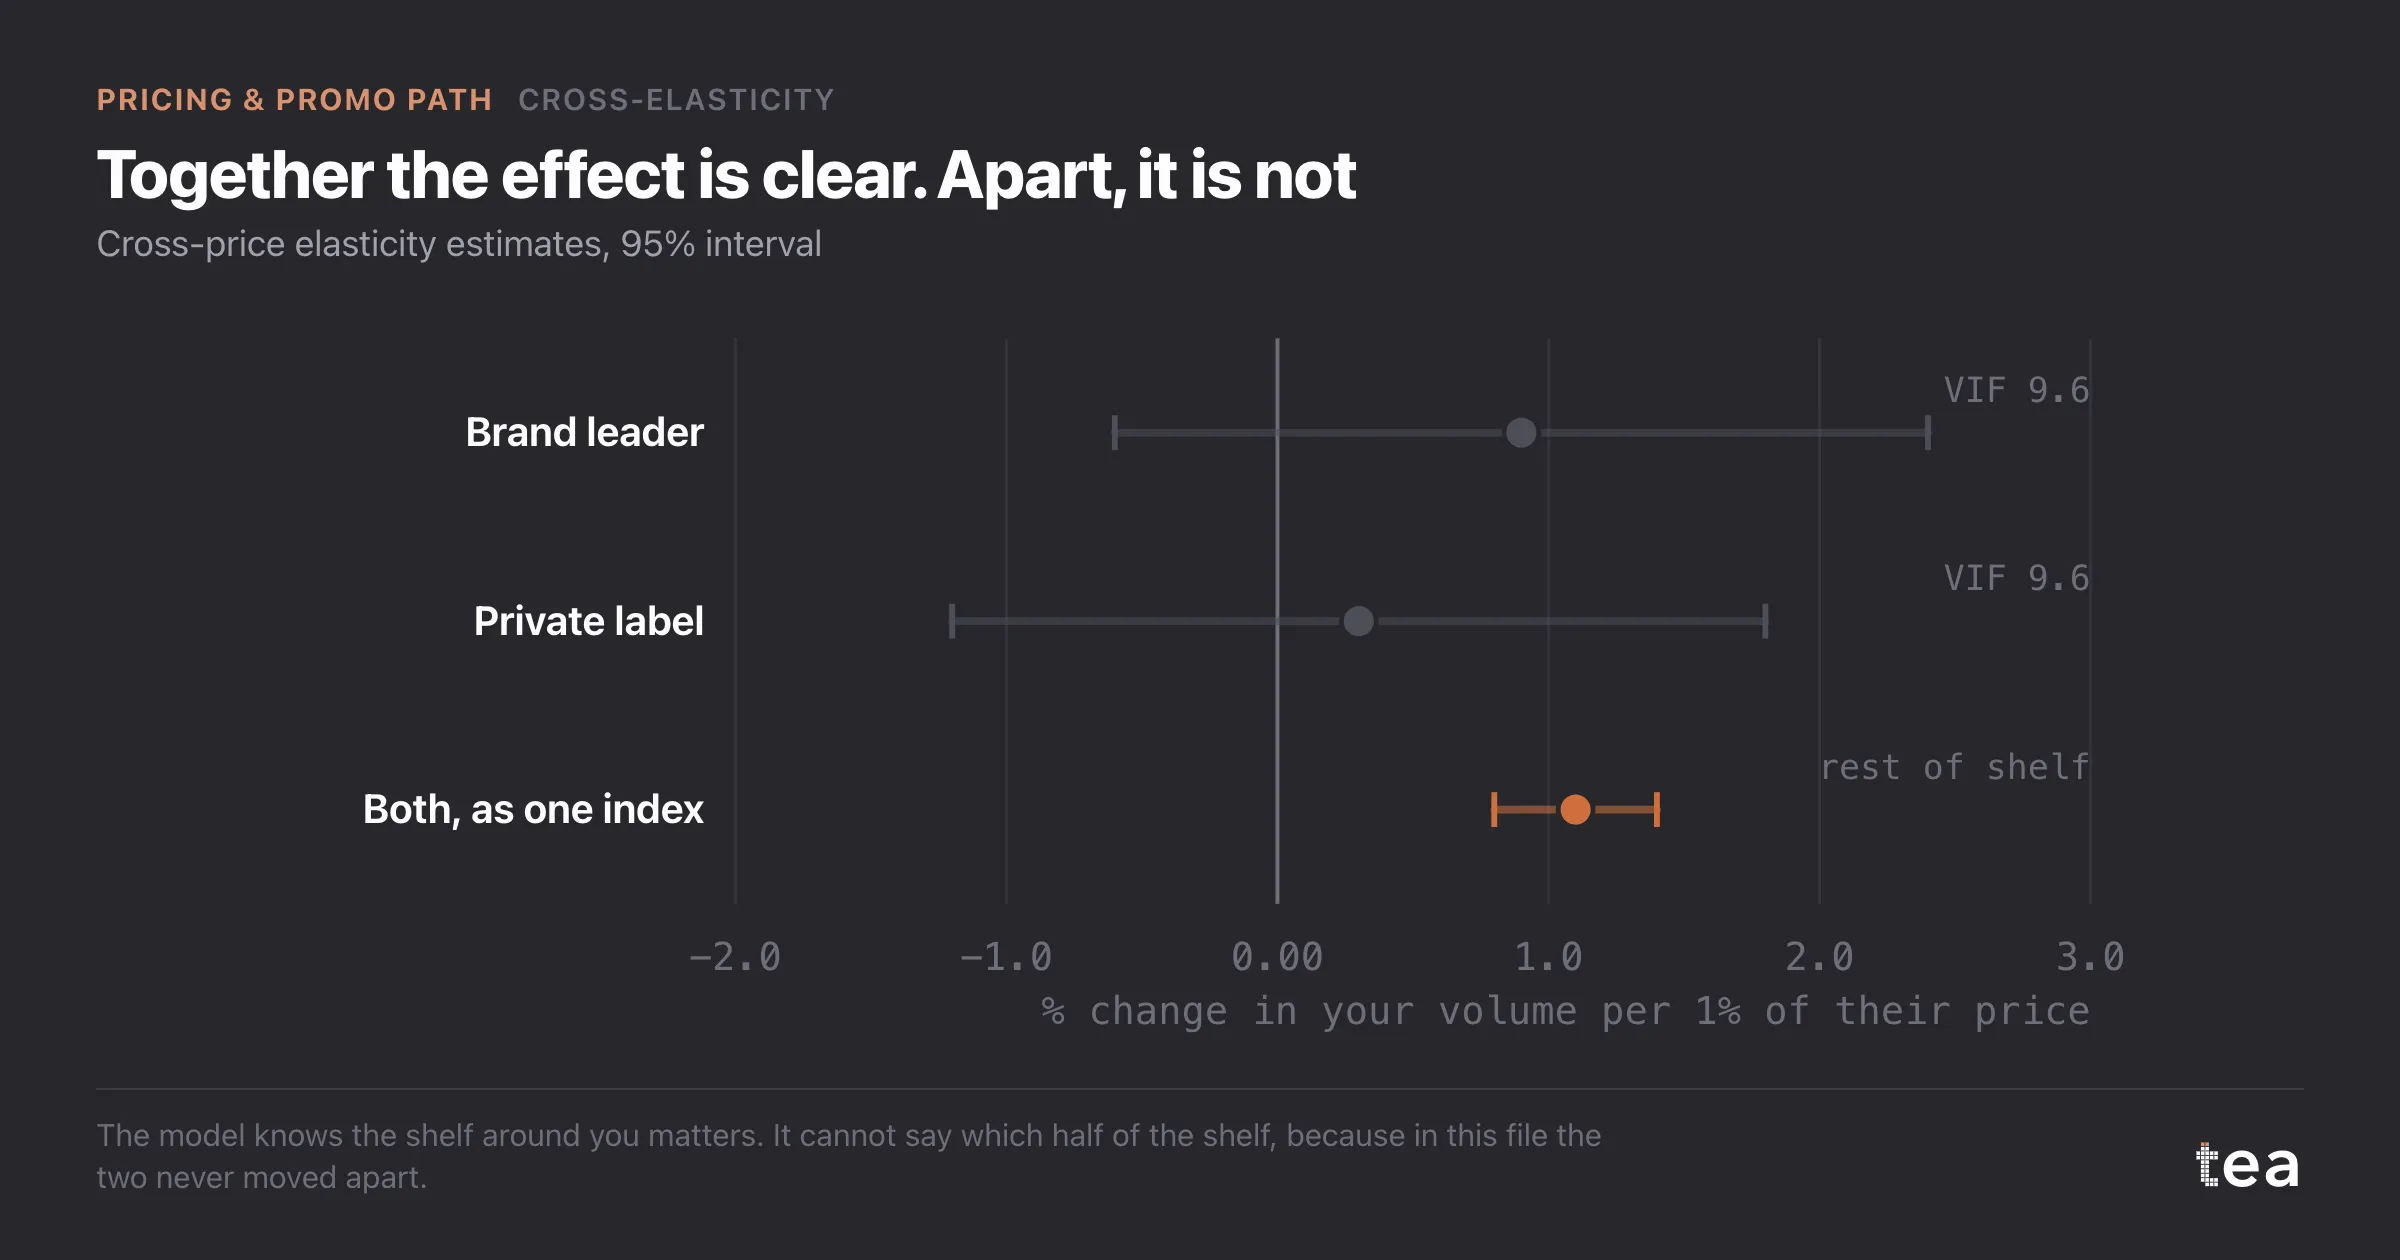
The two prices moved together. With a correlation of 0.94, the model sees one movement, not two. It can tell that when the shelf around you rose, your volume responded. It cannot divide that response between the leader and the private label, because every time one moved, so did the other. tea reports a variance inflation factor of 9.6 on both coefficients, which is its way of saying that each estimate is mostly noise borrowed from the other.
The leader's price was blind for most of each month. A monthly scrape misses everything between two Mondays. If the leader ran a two-week promotion in the middle of a month, the file never saw it. If the scrape landed on a promotion week, the file recorded a promotional price for four weeks that were mostly at full price. That is measurement error in a driver, and it has a known effect: it pulls the estimated coefficient towards zero, while widening its interval.
The result, separately: the leader at 0.9, with a 95% interval from -0.6 to 2.4. The private label at 0.3, interval from -1.2 to 1.8. Both intervals run comfortably through zero, and both are wide enough to hold any story anyone in the room wanted to tell.
Combine the two into one rest-of-shelf price index, weighted by share, and the picture is clear: 1.1, with an interval from 0.8 to 1.4. The shelf matters a lot. Which half of it matters is not in the data.
What would have gone wrong if forced
Read the central estimates and the leader wins, 0.9 against 0.3. That reading would have sent the brand's promotional budget after the leader, matching its offers, while the private label kept its everyday price and possibly kept the volume. Or the reverse. With intervals this wide, the ordering of the two central estimates is close to a coin toss, and a promotional strategy built on a coin toss is an expensive way to learn that.
What to do instead
- Get weekly competitor prices. A retail measurement panel, or the same scraper run every week instead of every month. The cost is small next to one misdirected promotion wave. Expect to need about a year of weekly data, including some weeks where the two competitors move apart, before the split is readable.
- Plan on the combined index meanwhile. The 1.1 is solid. For pricing scenarios, "the shelf goes up 5%" is a usable input even when "the leader goes up 5%" is not.
- Look for places where they moved apart. One retail chain held its private-label price for ten weeks while everyone else rose. If the file can be split by retailer, those ten weeks are the most informative rows the brand owns, and Geo / Segment MMM is built to read that kind of split.
- Ask shoppers. Switching studies are cheap and say who buyers consider. They do not replace the elasticity, but they can break a tie.
The brand did the first and the third, and agreed to take the question back to the Pricing & Promo path in a year.
The lesson
Two competitors who always move together are, to a model, one competitor. If you want to know which of them matters, you need weeks where they did different things, recorded at the same grain as your own data. A monthly price beside a weekly volume is not a lighter version of the same file. It is a different, weaker one.
tea, the product
Your file, this question
Fifteen analyses on a CSV of weekly data, with the intervals and the diagnostics shown, and a plain sentence when the data cannot answer. Free while in beta, by invitation.
Request a place in the beta→tea, the product
Fifteen econometric analyses on your own CSV: Cross-Elasticity, saturation curves, elasticities, budget allocation. Intervals and diagnostics shown, and a plain sentence when the file cannot answer.
Free while in beta, by invitation.
Request a place in the beta →Liked this? Run it on your own data.
tea runs Cross-Elasticity and fourteen other analyses on any weekly CSV, in minutes. Free while in beta, by invitation.
The Pricing & Promo Story
- Price elasticity when your shelf price never moved in three years
- Price elasticity of -1.4 and why a 5% price rise still paid
- Promo lift net of pull-forward: the 30% discount that never paid
- Promo elasticity when you are on promotion 48 weeks a year
- Cross-price elasticity: which competitor actually takes your volume
- Cross-elasticity when competitor prices are only monthly
- Scenario simulation for a promo calendar: the wave worth dropping (out October 28, 2026)