Household-goods maker, one washing-up liquid SKU in Italian grocery, asking whether a 5% list-price rise would cost volume.
A composite case, built from the kind of file we see most weeks. A mid-sized household-goods maker, and its biggest line: a one-litre washing-up liquid sold through Italian grocery, about 42,000 bottles a week at €3.49 on the shelf. Around €7.6M of revenue a year from one SKU, so every decimal on its price is a meeting.
The annual list-price round with the retailers was coming. The commercial director brought the question in one line: "Can we take 5% in March without losing the volume we lost last time?"
Last time was two years earlier. The brand had gone up 6% on its own, and volume fell about 8% over the following quarter. Nobody wanted to repeat it, and the default plan was to hold the price for another year.
What the file looked like
Three years of weekly data, 156 rows. Units, shelf price, promotion depth, weighted distribution, and the weekly shelf prices of the two main competitors and of the retailers' private label, from the retailers' own data.
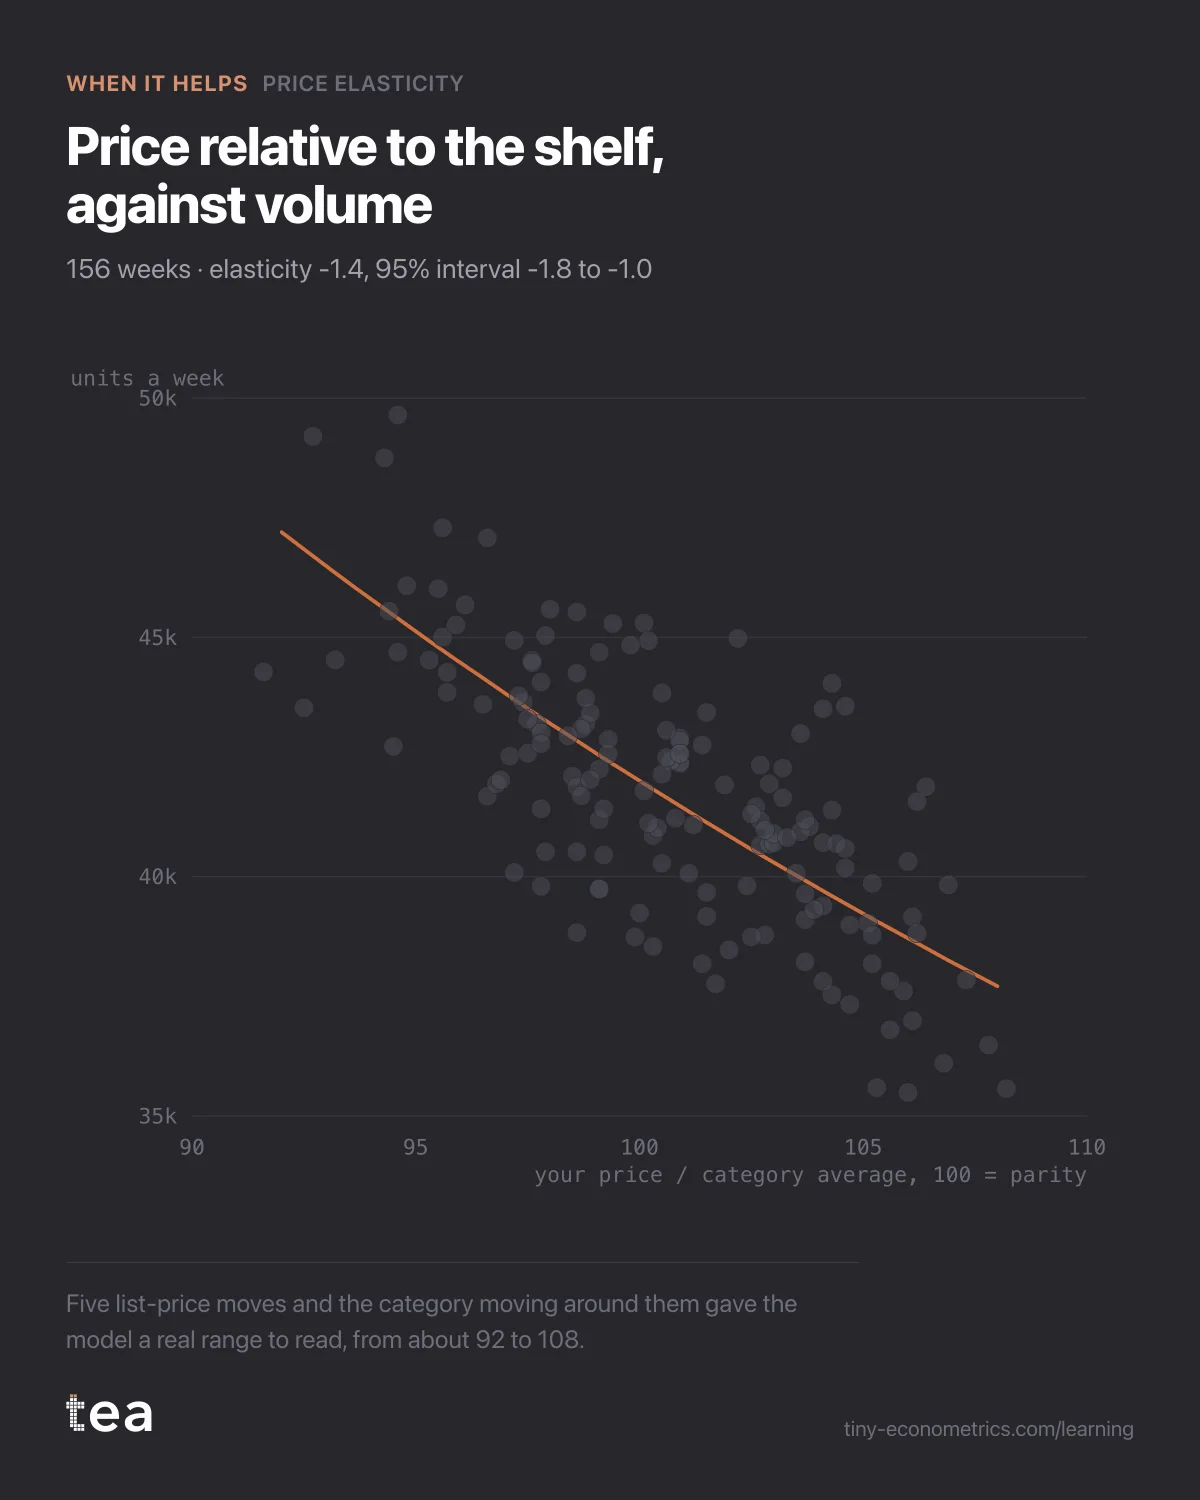
This is the file the previous post did not have. The brand had moved its list price five times in three years, up and down, and the competitors had moved theirs at different moments. The ratio of the brand's price to the category average ran from about 92 to 108, which is a real range to learn from. There were also promotions, so the model had to keep them apart: a week at 25% off is a price change with a display attached, and crediting the price alone would make shoppers look far more sensitive than they are.
What the analysis did
Price Elasticity fits the log of volume against the log of price, so the coefficient reads directly as an elasticity: the per cent change in volume for a one per cent change in price. Season, distribution and promotion depth sit in the model as controls.
The first specification used the brand's own price and the category average separately. Own price came back at -1.4, the category average at +1.3, close enough to equal and opposite that a simpler form was justified: volume answers the brand's price relative to the shelf around it. Refitted that way, the elasticity is -1.4, with a 95% interval from -1.8 to -1.0. R² was 0.87 and the residuals showed no pattern the model had missed.
The relative form also explained the scar. Two years ago the brand went up 6% while the category did not move. A 6% relative rise at -1.4 predicts a volume loss of about 8%, which is what happened. The model was not contradicting the memory. It was explaining it.
The decision it changed
Shoppers do not read a price in isolation. They read it against the bottle next to it. So the question became: what will the shelf do in March?
The answer was mostly known. Input costs had risen across the category, the leader had already filed a 4% rise with the main retailers, the second brand 3.5%, and the private label was expected to follow by about 3%. Weighted by share, the category average was set to rise by about 3.6%.
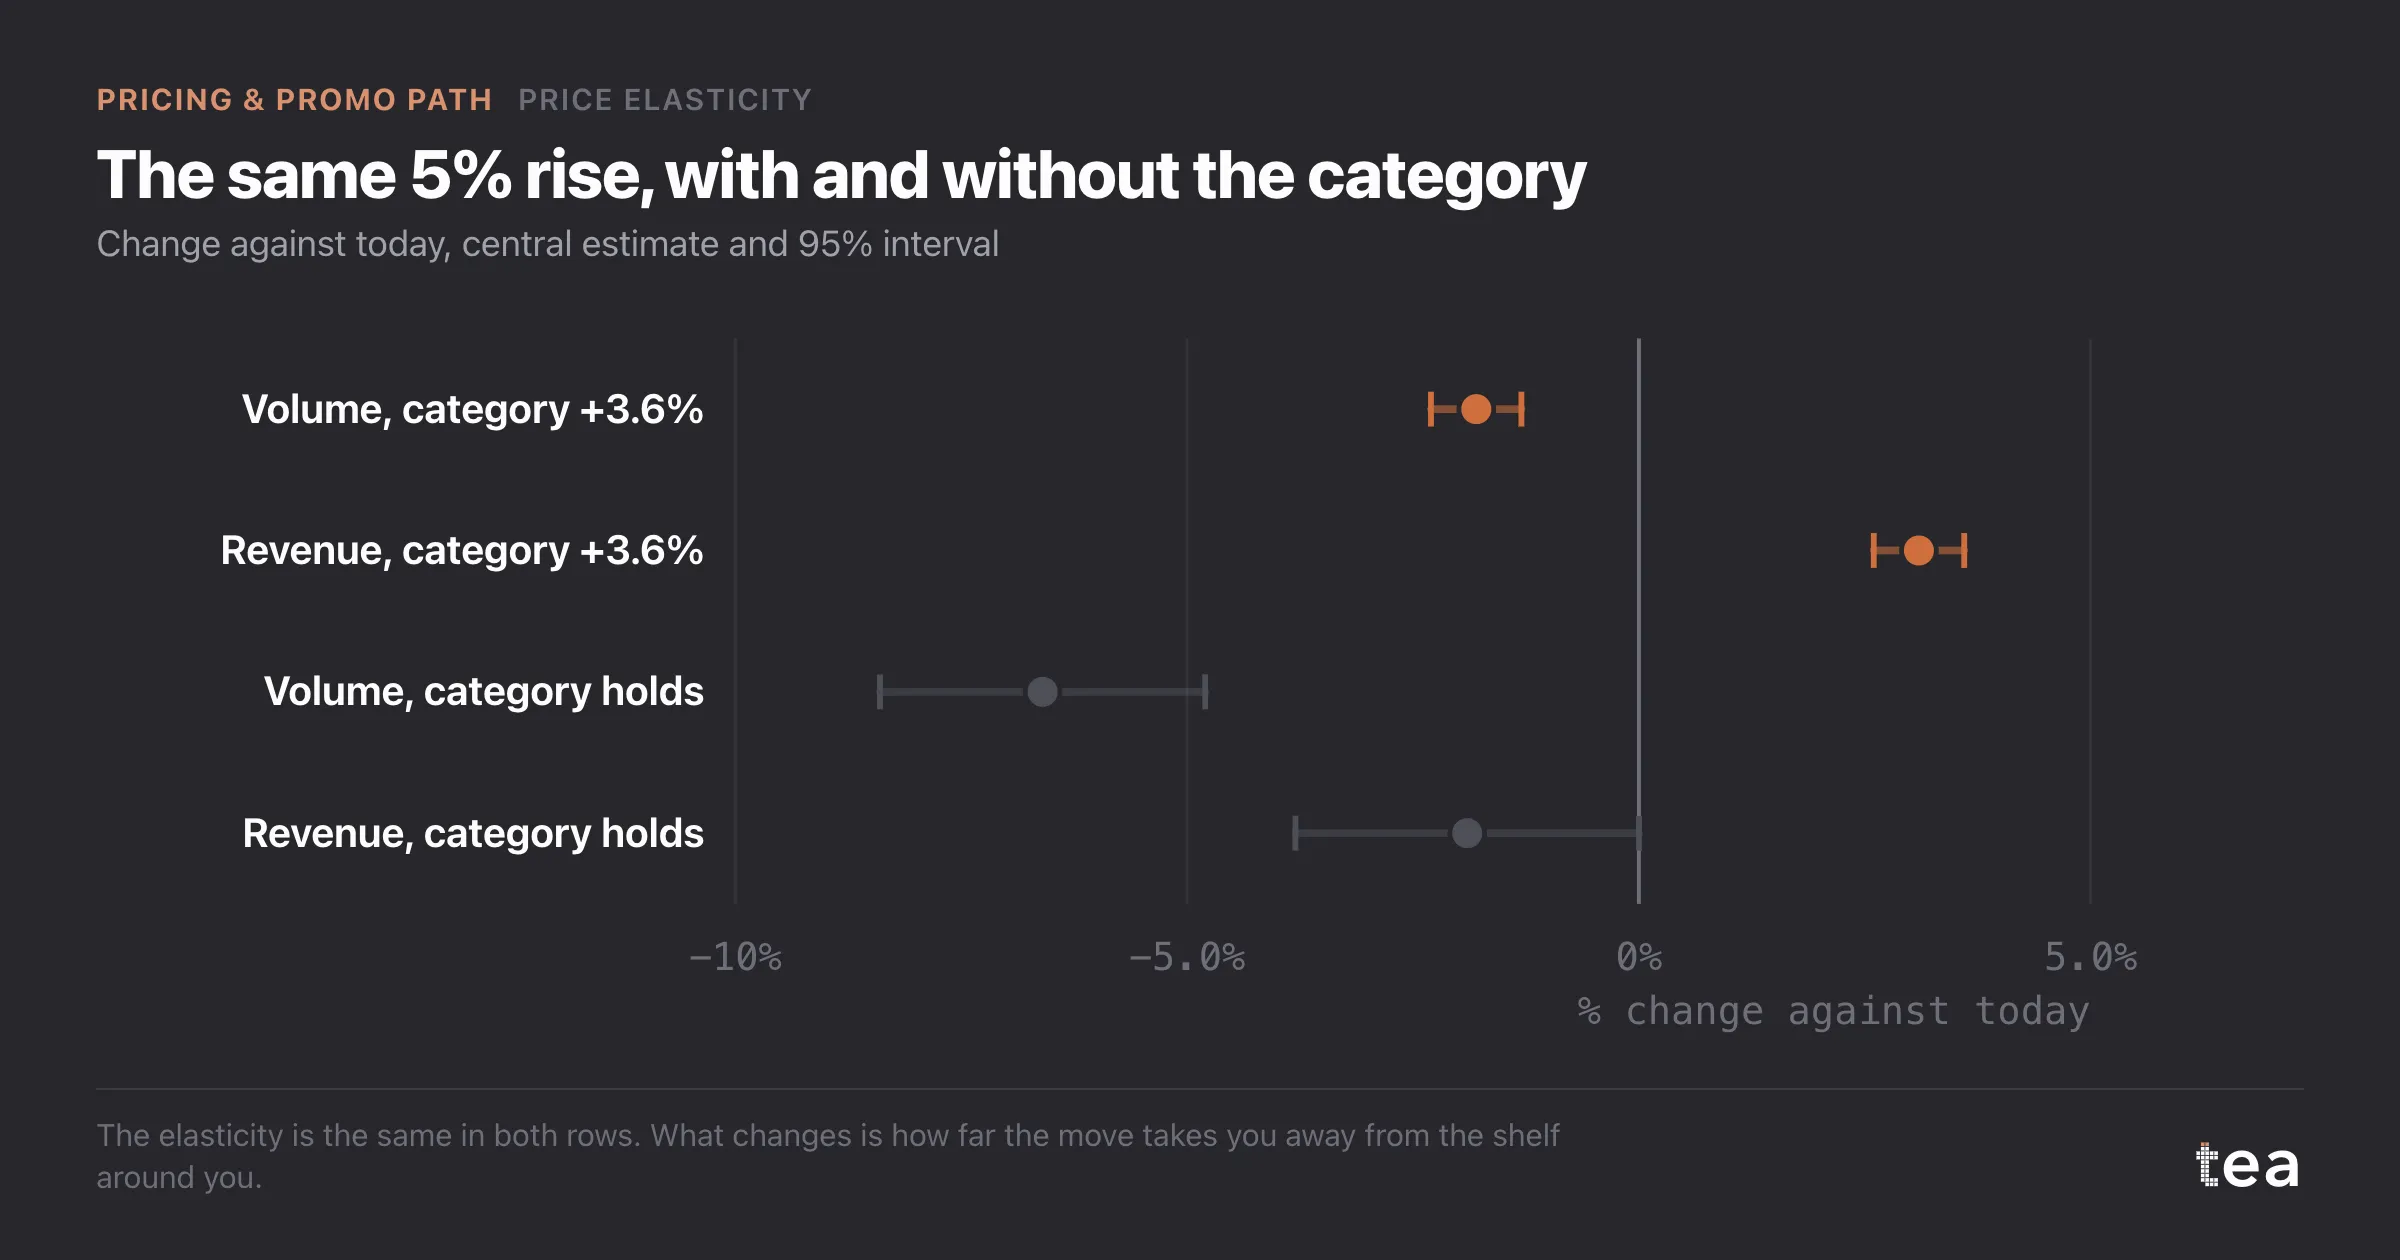
A 5% rise on top of a 3.6% category move is a relative rise of about 1.3%. At -1.4 that costs 1.8% of volume, with the interval putting it between 1.3% and 2.3%. Revenue goes up 3.1%, between 2.6% and 3.6%. On €7.6M that is about €236k a year.
The same 5% taken alone, with the category holding still, would have cost 6.6% of volume and 1.9% of revenue. The elasticity is identical in both cases. Only the shelf around the move is different, and that is what the chart in the middle of this page shows.
Holding the price would have looked attractive on volume: with the category going up 3.6% around it, the brand would have gained about 5% of units. But it would have done so at €3.49 against the same cost inflation that was pushing everyone else's price up, and the finance team measured the year on gross margin. On margin, the 5% rise came out ahead.
What changed: the plan to hold was replaced by a 5% rise, timed in the same March window as the category rather than in autumn, when the brand would have been the only one moving. The first eight weeks after the change came in 1.6% below the previous year's volume, inside the predicted interval.
The limits, printed with the result
The estimate holds inside the range the brand has actually priced in, roughly 92 to 108 relative to the category. A relative price of 115 is outside anything the file has seen, and an elasticity extrapolated that far is an opinion in decimal form.
And it is a model of observed weeks, not an experiment. The controls take out what can be measured. What the competitors do next is the one input the brand does not control, which is why cross-elasticity is the next step on the Pricing & Promo path.
The lesson
An elasticity of -1.4 does not mean a price rise loses revenue. It means a price rise relative to the shelf loses revenue. The same 5% is a mistake on its own and a sensible move in company, and the model can only tell you which one you are making if competitor prices are in the file.
The Pricing & Promo Path
- Price elasticity when your shelf price never moved in three years
- Price elasticity of -1.4 and why a 5% price rise still paid
- Promo lift net of pull-forward: the 30% discount that never paid (out October 8, 2026)
- Promo elasticity when you are on promotion 48 weeks a year (out October 13, 2026)
- Cross-price elasticity: which competitor actually takes your volume (out October 18, 2026)
- Cross-elasticity when competitor prices are only monthly (out October 23, 2026)
- Scenario simulation for a promo calendar: the wave worth dropping (out October 28, 2026)