Dry cat food brand in French grocery, about 25,000 bags a week, asking whether to keep matching a neighbouring brand's price cuts.
A composite case, built from the kind of file we see most weeks. A dry cat food brand sold in French grocery, 2 kg bags at €9.90, about 25,000 bags a week. Two other brands mattered in the category conversation. Brand A, a national brand at a similar price. And Brand B, a slightly more premium brand that sat right next to it on most shelves and promoted often.
For two years the brand had a rule: when Brand B cut its price, match it within the fortnight. Last year that meant five two-week price-offs at 15%, triggered by Brand B, and two triggered by Brand A. The new category manager asked the question that nobody had asked out loud: "Are we matching the right people?"
What the file looked like
Three years of weekly data, 156 rows. Own units, own shelf price, promotion depth, distribution, and the weekly shelf prices of Brands A and B from the retailers' data, at the same weekly grain as everything else. That last detail matters more than it sounds, and a later post shows what happens without it.
The prices had moved for different reasons at different times. Brand A changed its list price twice and promoted about four times a year. Brand B promoted roughly every six weeks. Their prices were correlated at 0.31, which is low enough to tell them apart.
What the analysis did
Cross-Elasticity puts your own price and each competitor's price in the same model, in logs, so each coefficient reads as a per cent change in your volume for a one per cent change in that price. Season, distribution and your own promotions sit alongside as controls.
Two details make the difference between a number and a guess.
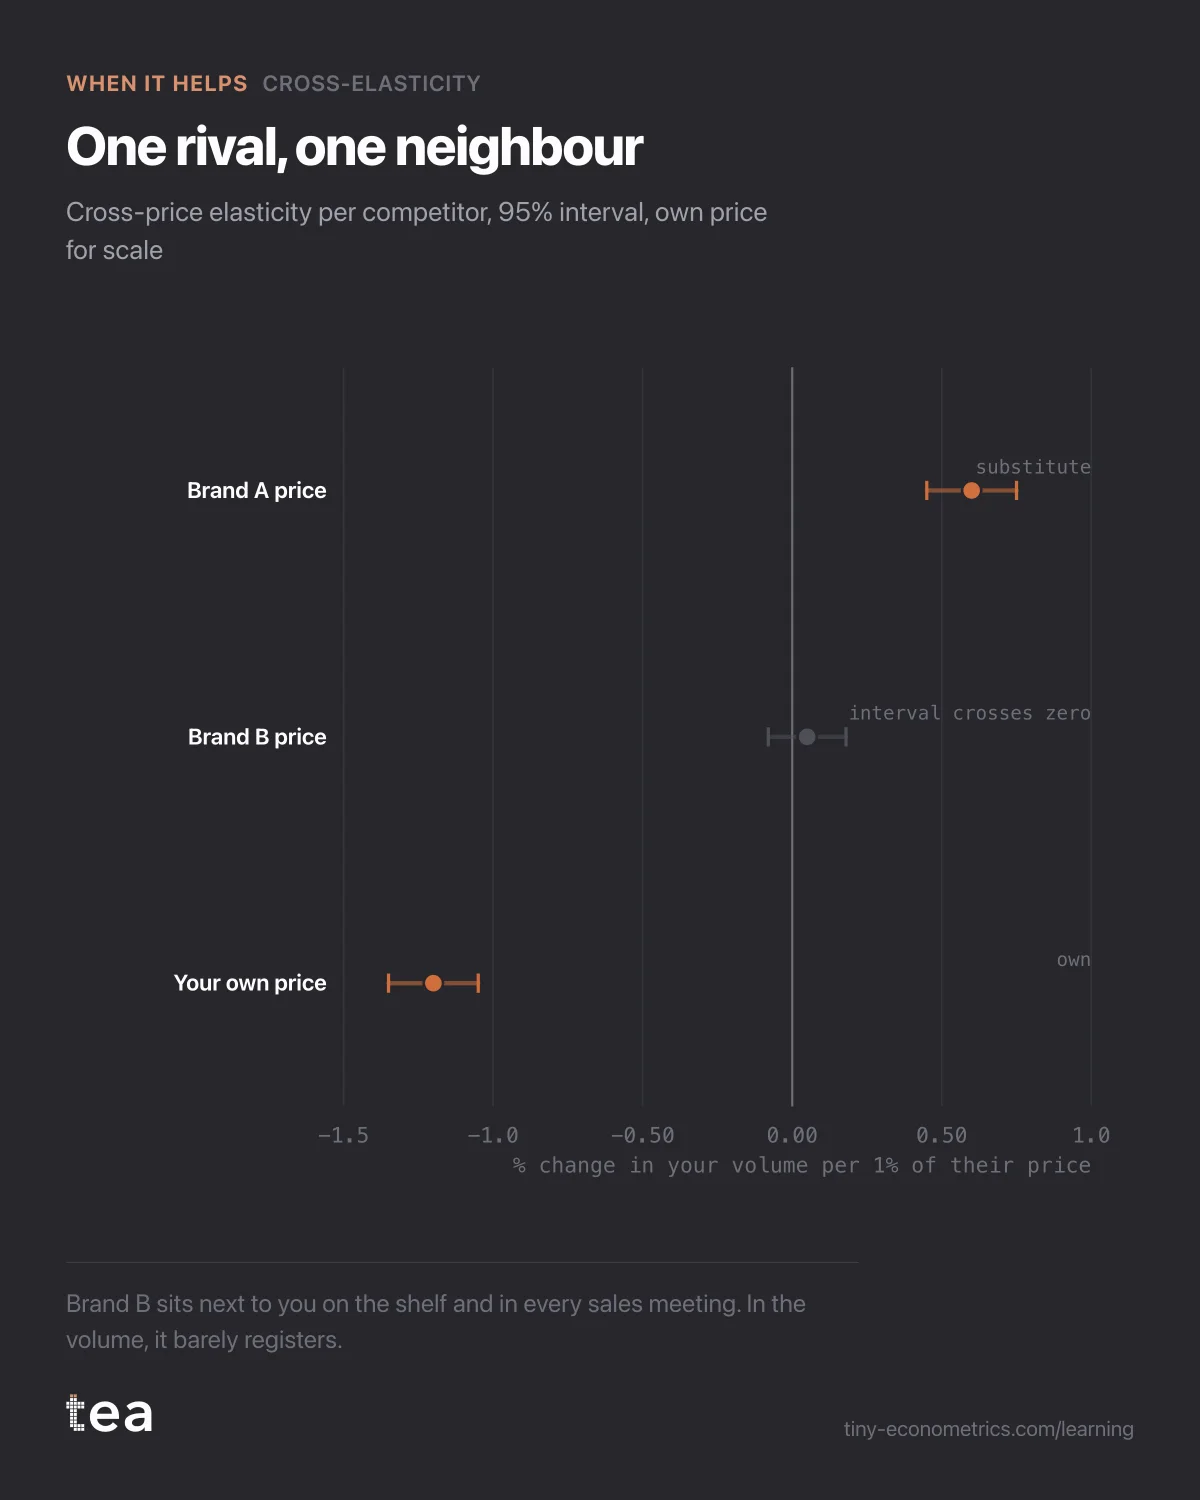
Your own price has to be in the model. Without it, a competitor's coefficient absorbs whatever you did with your own price in the same weeks. Here the brand had often cut its price right after Brand B did, so leaving its own price out would have made Brand B look like a strong rival, simply because the brand's own matching moved volume in those weeks. Own-price elasticity came back at -1.2, with an interval from -1.35 to -1.05.
And the competitors have to be separable. tea reports a variance inflation factor for each price. Here they were all below 1.3: each price had moved enough on its own for its effect to be read on its own.
The result:
- Brand A: 0.6, 95% interval 0.45 to 0.75. When Brand A's price goes up 1%, your volume goes up about 0.6%. When it comes down, yours goes with it. That is a substitute.
- Brand B: 0.05, 95% interval -0.08 to 0.18. The interval contains zero. Brand B's price moves do not measurably touch your volume.
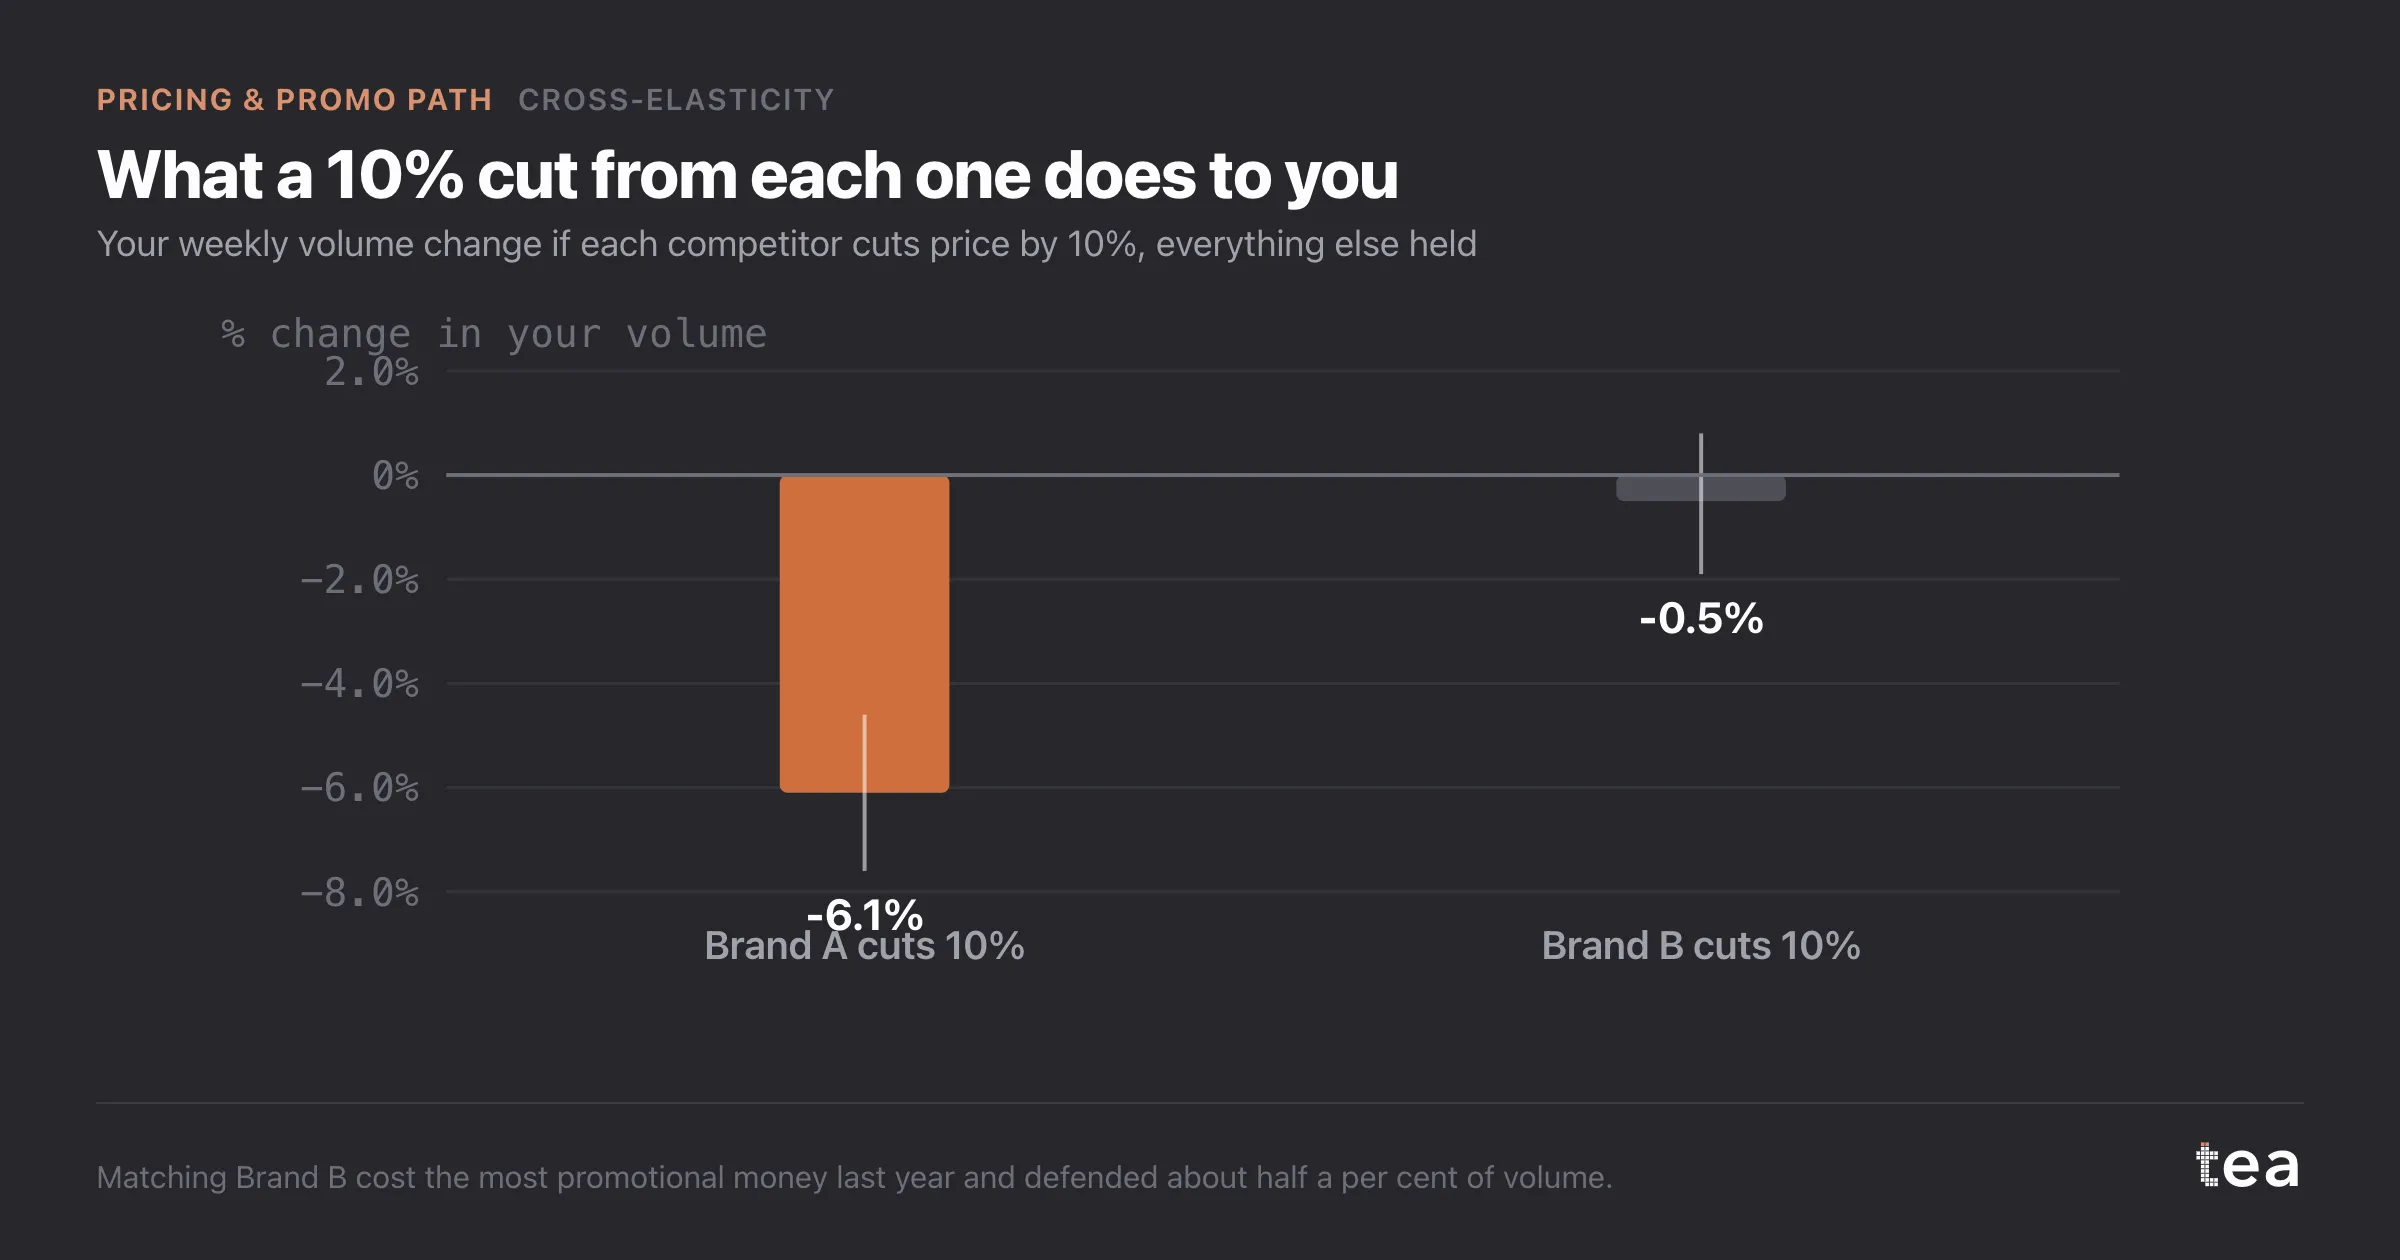
A 10% cut by Brand A takes about 6.1% of your weekly volume, between 4.6% and 7.6%. The same cut by Brand B takes about 0.5%, and the interval runs from a 1.9% loss to a 0.8% gain.
Why would the brand on the next shelf not be a rival? On this file the likeliest reason is that Brand B's buyers were a different group: owners on a vet-recommended diet who did not see the two bags as interchangeable, and who stuck with B at either price. The data cannot prove the reason. It can show the effect.
The decision it changed
Each matching price-off cost money. Two weeks at 15% off, at the brand's own elasticity, lifted volume by about 21% but gave €1.49 away on every bag, including the 50,000 that would have sold anyway. Net of the extra volume, each one cost about €50k of gross margin.
Five of those had been spent answering Brand B, about €250k, to defend roughly half a per cent of volume for two weeks at a time: around 125 bags a week.
The rule changed in two ways. The brand stopped matching Brand B altogether. And for Brand A it stopped matching short promotions, which come and go before a response lands, and instead prepared a response for a list-price move. A permanent 10% cut by Brand A would cost about 6% of volume all year, roughly €275k of margin, and that is worth a considered answer rather than a reflex.
The first year under the new rule saved the five Brand B price-offs. Volume over the same period was flat against the previous year, within half a per cent.
The lesson
The competitive set in most category plans is built from who sits nearby and who the sales team talks about. Some of it is right. Cross-elasticity separates the brand that takes your volume from the brand that only takes your attention, and on this file the difference was twelve to one. Measure it before you match anyone. That is why it sits third on the Pricing & Promo path.
tea, the product
Your file, this question
Fifteen analyses on a CSV of weekly data, with the intervals and the diagnostics shown, and a plain sentence when the data cannot answer. Free while in beta, by invitation.
Request a place in the beta→tea, the product
Fifteen econometric analyses on your own CSV: Cross-Elasticity, saturation curves, elasticities, budget allocation. Intervals and diagnostics shown, and a plain sentence when the file cannot answer.
Free while in beta, by invitation.
Request a place in the beta →Liked this? Run it on your own data.
tea runs Cross-Elasticity and fourteen other analyses on any weekly CSV, in minutes. Free while in beta, by invitation.
The Pricing & Promo Story
- Price elasticity when your shelf price never moved in three years
- Price elasticity of -1.4 and why a 5% price rise still paid
- Promo lift net of pull-forward: the 30% discount that never paid
- Promo elasticity when you are on promotion 48 weeks a year
- Cross-price elasticity: which competitor actually takes your volume
- Cross-elasticity when competitor prices are only monthly (out October 23, 2026)
- Scenario simulation for a promo calendar: the wave worth dropping (out October 28, 2026)