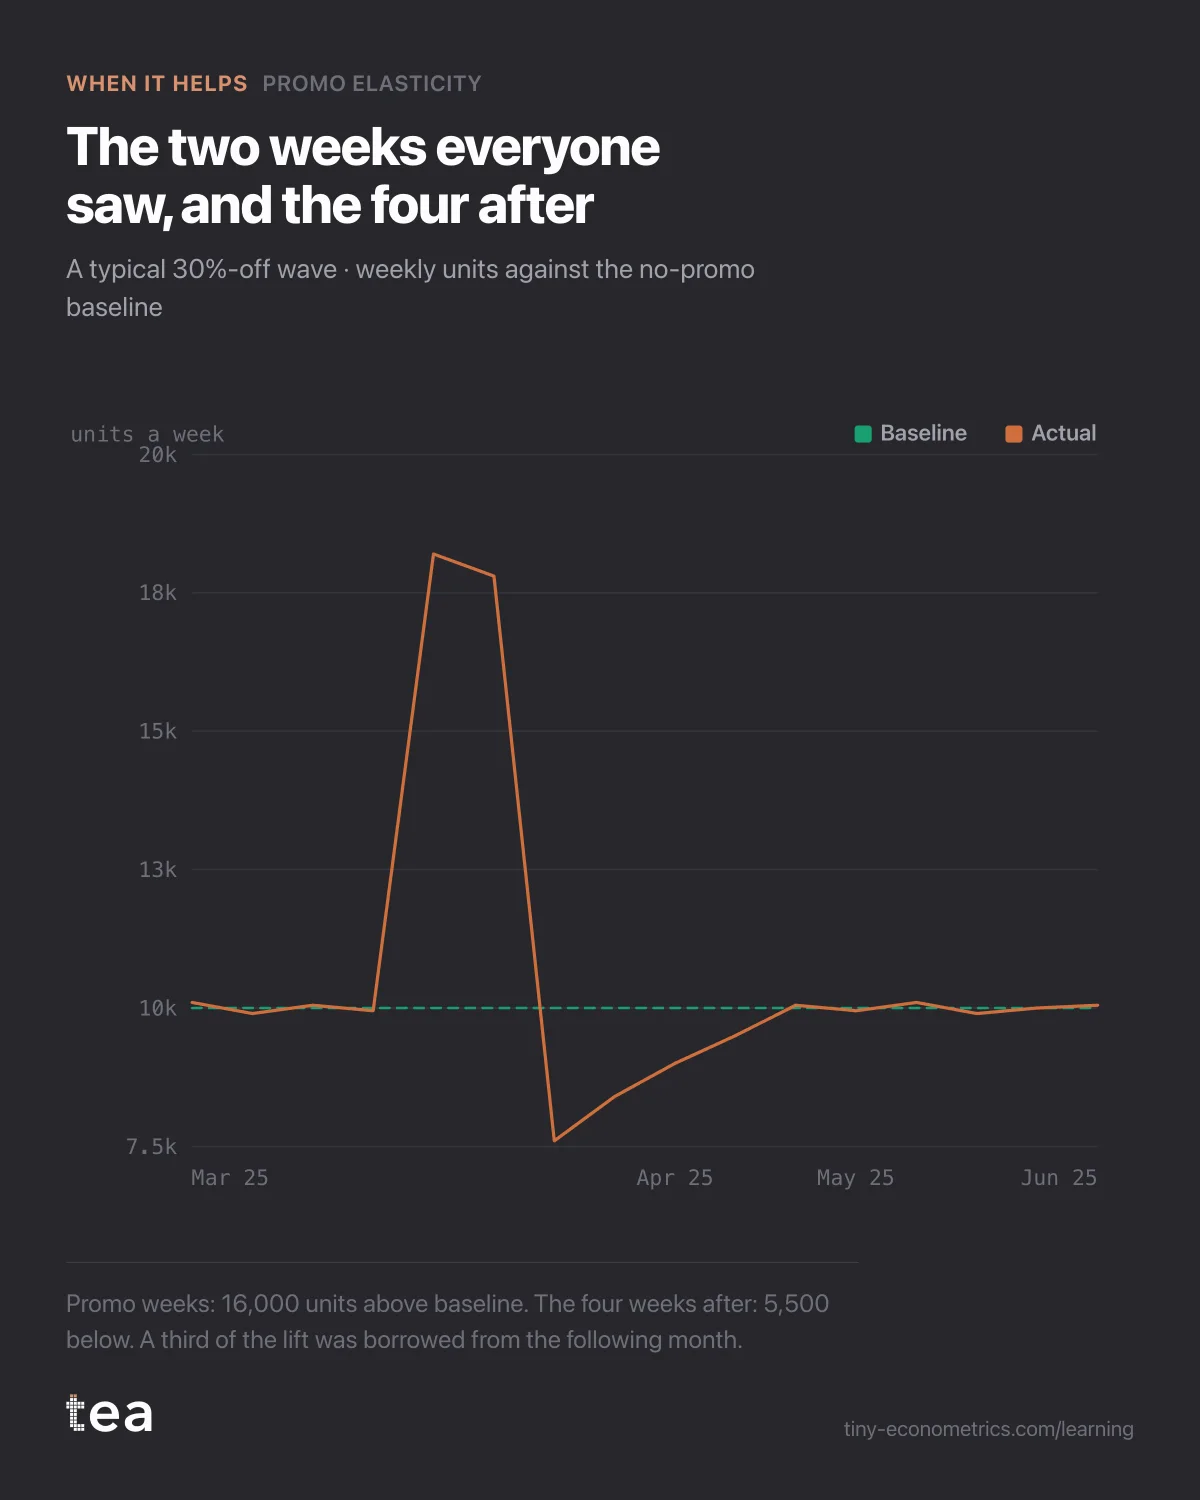
Biscuit brand, 400 g packs in Spanish grocery, about 10,000 packs a week, asking whether to add a seventh 30%-off wave.
A composite case, built from the kind of file we see most weeks. A biscuit brand selling 400 g packs through Spanish grocery, about 10,000 packs a week at €4.00 on the shelf, with a gross margin of €1.80 a pack. Six times a year it ran a two-week promotion at 30% off, and every time the promotion weeks came in about 80% above normal.
The retailer offered a seventh slot. The brand manager's question was simple: "Our promotions deliver +80%. Should we take the extra wave?"
What the file looked like
Three years of weekly data, 156 rows, 18 promotion waves. Units sold, shelf price, promotion depth as a percentage, a feature-and-display flag, distribution, and a column for the brand's small digital budget.
Two things made this file good for the question. The depth column held the actual discount, not a yes-or-no flag, and it was nearly always 30%, with two waves at 20% from a year when the retailer pushed back. And the waves were spaced out, usually six to ten weeks apart, so the weeks after each promotion were visible on their own instead of running into the next one.
The internal report measured each wave by comparing the two promotion weeks with the two weeks before. On that reading a typical wave sold 36,000 packs against a baseline of 20,000. That is the +80%, and it is real.
What the analysis did
Promo Elasticity does two things the internal report did not.
First, it estimates the baseline with the whole year around it, so season and distribution do not leak into the lift. On this file that changed little: the gross lift came out at +80%, with a 95% interval from +72% to +88%.
Second, it looks at what happens after the promotion. The model includes the weeks following each wave as their own terms, so if volume falls below baseline after a promotion, that fall is measured rather than ignored. Here it fell clearly. The four weeks after a typical wave sold 24%, 16%, 10% and 5% below baseline, and then volume was back to normal.
That dip is pull-forward. Shoppers who would have bought a pack in three weeks bought two packs at 30% off and then did not come back for a while. Biscuits keep, and the cupboard does the rest. Across the four weeks it adds up to 5,500 packs: 34% of the promotion's apparent lift was demand borrowed from the following month.
Net of the dip, a typical wave sold 10,500 extra packs, not 16,000.
The verdict, in money
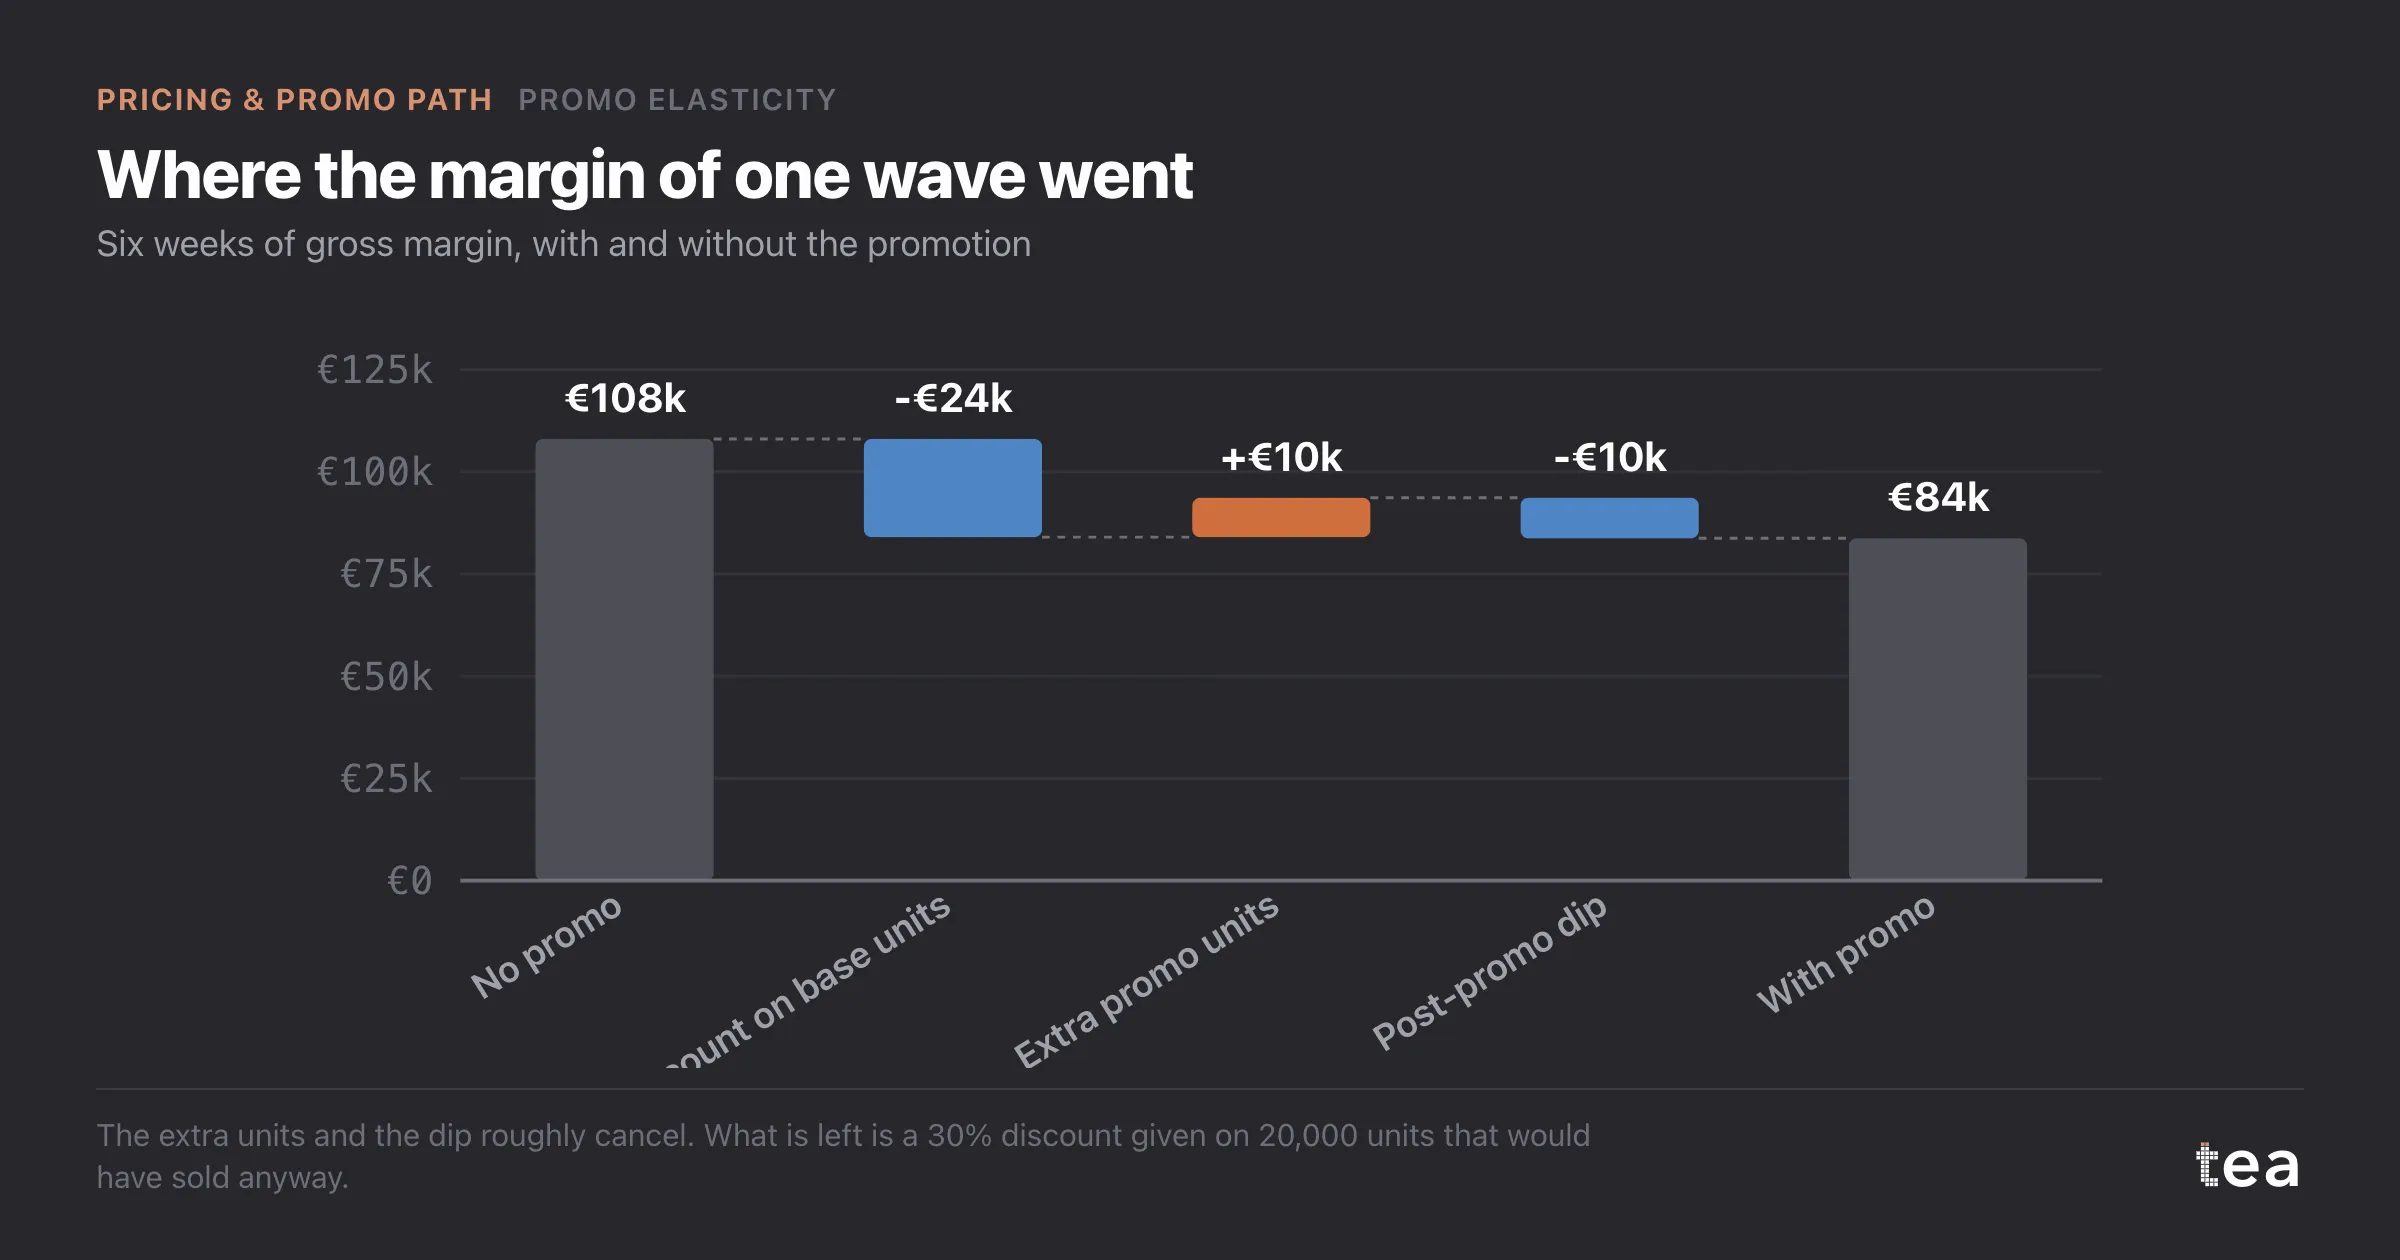
Now price the wave. The waterfall in this post does it for one typical wave over six weeks.
- Without the promotion, those six weeks earn €108k of gross margin.
- The 20,000 packs that would have sold anyway in the promotion weeks were sold at €1.20 less each. That is €24k given away.
- The 16,000 extra packs in the promotion weeks earned €0.60 each at the discounted price. That is €9.6k.
- The dip took 5,500 full-price packs out of the following month, at €1.80 each. That is €9.9k.
The extra packs and the dip almost cancel. What is left is a 30% discount on volume the brand would have sold anyway, and the wave ends about €24k down on margin. Revenue is roughly flat, down about €1,200, which is why the promotion never looked like a problem in the sales report.
For a 30% discount to pay on margin at this brand, the promotion weeks would need to triple their volume, net of the dip: a net lift of +200%. The measured net lift was about +53%. No wave in three years came close.
The decision it changed
The seventh wave was declined. The other six were cut to three, because the retailer's feature space came with a minimum commitment, and those three moved from 30% to 20%. The two 20% waves in the history gave the model a second depth to read: a gross lift of about +45%, with the same third of it pulled forward. At 20% each wave still loses margin, about €12.6k instead of €24k, but there are half as many of them.
Estimated loss from the promotional calendar: from about €146k a year to about €38k. The brand did not pretend the remaining three waves were an investment. It called them the cost of the feature space, and budgeted them as such.
One control mattered here, and it links back to the price post: the model kept promotion depth and shelf price apart, so the price elasticity was not inflated by promotion weeks and the promotion lift was not deflated by them.
The lesson
A promotion's lift is not the promotion weeks. It is the promotion weeks plus the weeks after, and for anything that keeps in a cupboard the weeks after are where a third of the lift goes back. Measure the dip before you measure the success. The Pricing & Promo path puts this step second for that reason, and the next post is what happens when there is no normal week to measure against at all.
tea, the product
Your file, this question
Fifteen analyses on a CSV of weekly data, with the intervals and the diagnostics shown, and a plain sentence when the data cannot answer. Free while in beta, by invitation.
Request a place in the beta→tea, the product
Fifteen econometric analyses on your own CSV: Promo Elasticity, saturation curves, elasticities, budget allocation. Intervals and diagnostics shown, and a plain sentence when the file cannot answer.
Free while in beta, by invitation.
Request a place in the beta →Liked this? Run it on your own data.
tea runs Promo Elasticity and fourteen other analyses on any weekly CSV, in minutes. Free while in beta, by invitation.
The Pricing & Promo Path
- Price elasticity when your shelf price never moved in three years
- Price elasticity of -1.4 and why a 5% price rise still paid
- Promo lift net of pull-forward: the 30% discount that never paid
- Promo elasticity when you are on promotion 48 weeks a year (out October 13, 2026)
- Cross-price elasticity: which competitor actually takes your volume (out October 18, 2026)
- Cross-elasticity when competitor prices are only monthly (out October 23, 2026)
- Scenario simulation for a promo calendar: the wave worth dropping (out October 28, 2026)