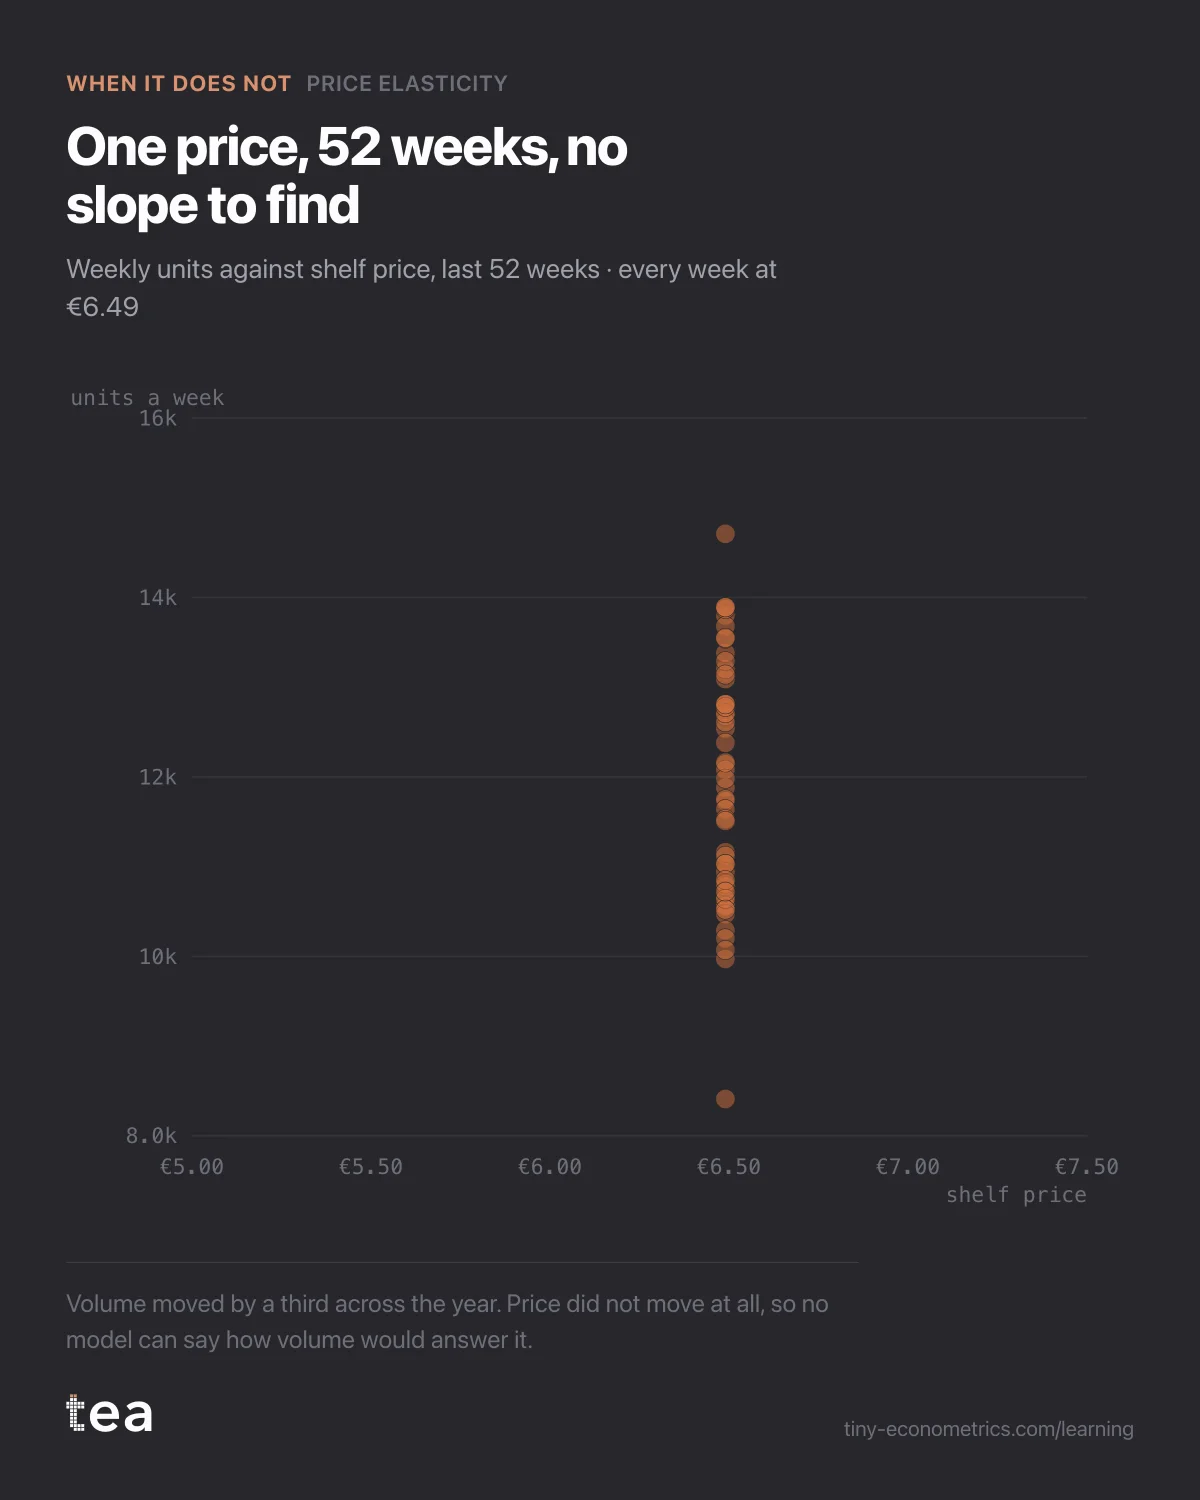
Premium coffee brand, ground coffee in Italian and Austrian grocery, asking what a move from €6.49 to €6.99 would cost in volume.
A composite case, built from the kind of file we see most weeks. A premium coffee roaster selling 250 g bags of ground coffee through grocery in northern Italy and Austria, about 12,000 bags a week, at one shelf price: €6.49. Coffee costs had gone up twice in eighteen months and the finance director wanted to know whether the brand could take the price to €6.99.
The question, as it arrived: "If we go to €6.99, how many bags do we lose?"
It is the right question, and it is the one Price Elasticity is built for. On this file it could not answer it.
What the file looked like
Three years of weekly rows, 156 of them. Units sold, shelf price, weighted distribution, a column of media spend, and the weekly shelf price of the main competitor taken from the retailer's data. No promotions: the brand had a policy of never discounting, which was part of its premium positioning and which nobody wanted to change.
Volume moved a lot. The winter weeks ran about a third above the summer ones, distribution grew from 61% to 74% over the period, and a television flight in the second autumn left a visible bump. There was plenty to model.
The price column was the problem. It said €6.49 in every one of the 156 rows. The list price had not changed, the brand never promoted, and the retailers had held the shelf price exactly where the brand recommended.
Why the maths has nothing to read
An elasticity is a slope. It says how much volume moves, in per cent, when price moves by one per cent. A regression estimates that slope by looking at weeks where price was higher and weeks where it was lower, and seeing what volume did in each, with everything else that moved (season, distribution, media) held to one side.
If price never moves, there are no higher weeks and no lower weeks. The slope is not small or uncertain. It is undefined, in the same way you cannot work out the gradient of a road by standing on one spot. In the scatter of volume against price, all 156 points sit on one vertical line at €6.49. Volume goes up and down along that line for every reason except price.
tea says this directly: the price column has no variance, so no own-price elasticity can be estimated from this file. That is not a cautious answer. It is the only true one.
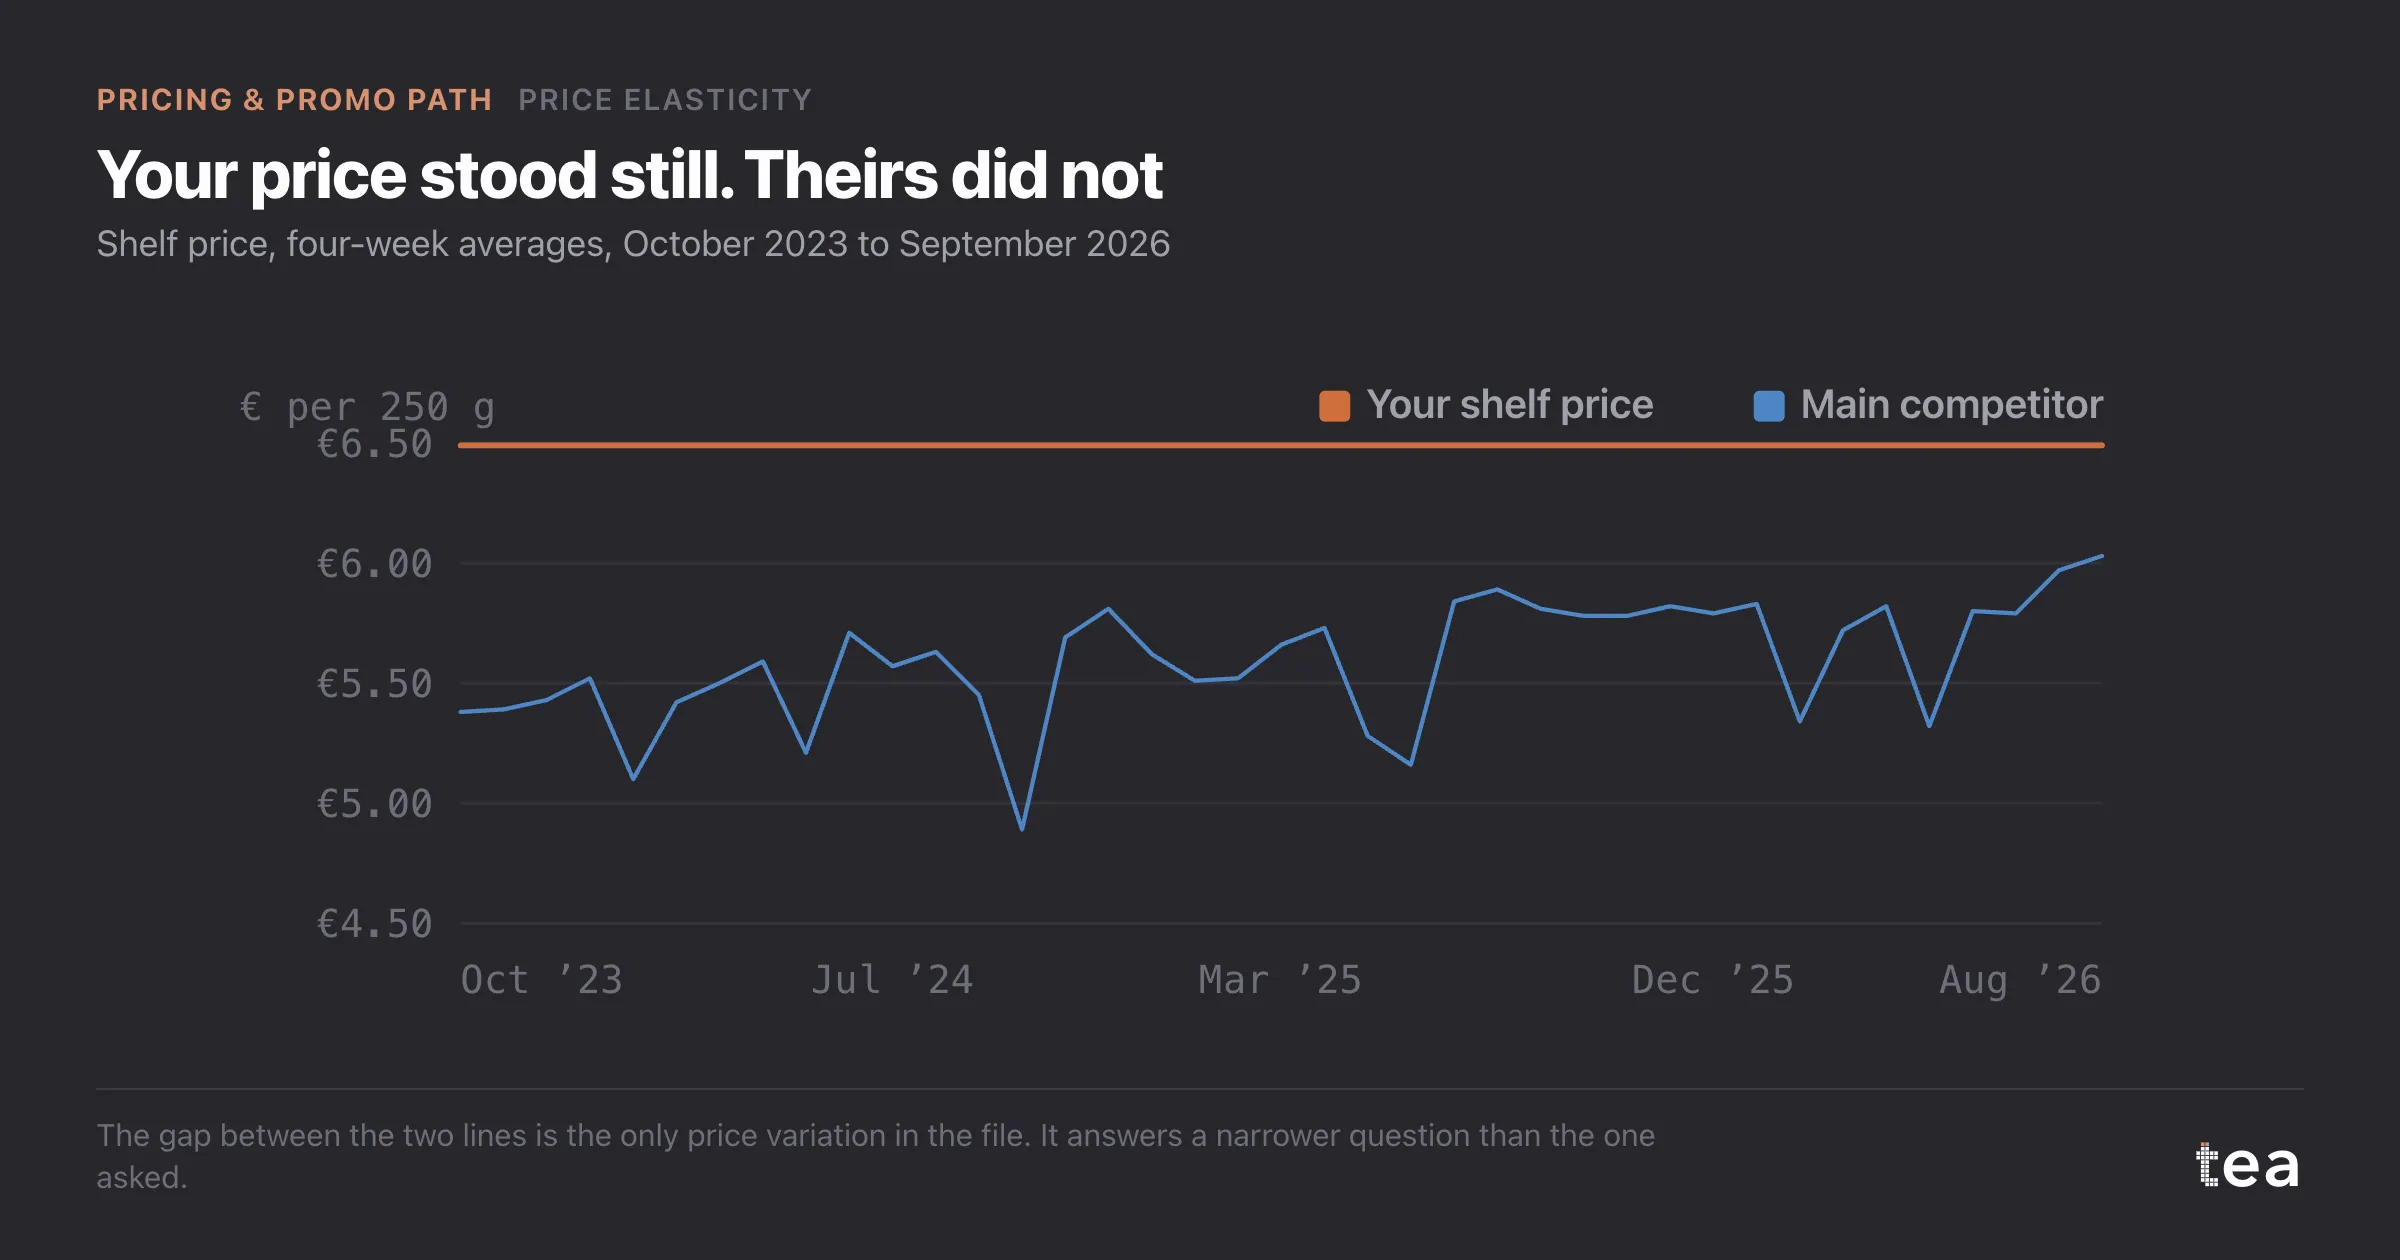
What would have gone wrong if forced
There are three ways people force an answer here, and each produces a number that looks like a finding.
The first is to borrow one. Category benchmarks for coffee put own-price elasticity somewhere between -0.6 and -2.0. Pick -1.2 and a 7.7% rise costs about 9% of volume. Pick -0.6 and it costs about 4.5%. The range is the whole decision, and the benchmark was measured on other brands, mostly mainstream ones that promote every month.
The second is to use the competitor. Their price did move, so the gap between your price and theirs moved too, between roughly €0.55 and €1.60 a bag. Fit volume against that gap and you get a relative-price elasticity: on this file, -0.9 with a 95% interval from -1.7 to -0.1. That is a real estimate, but of a different thing. It says how your volume answers when the competitor moves. Using it for your own rise assumes your shoppers react to your €0.50 the way they react to their discount, and premium buyers who know your price by heart often do not. That is the territory of Cross-Elasticity, and it is an assumption, not a measurement.
The third is the quiet one: wait for a stock-out week or a retailer error where the shelf showed €5.99, and fit on that. Three accidental weeks will give you a coefficient, and an interval wide enough to drive a truck through.
What to do instead
The honest answer was that this file could describe everything about the brand except its price. To learn the price response, the brand had to move its price on purpose, small and controlled.
- A price test in a few stores. Twelve stores at €6.99, twelve matched stores at €6.49, ten weeks. With weekly volume this stable, ten weeks is enough to read a volume change of 5% or more with reasonable confidence. If the loss turns out to be small, the rise rolls out. If it is large, the brand has lost a little volume in twelve stores instead of in all of them.
- A conjoint or price-ladder survey, to set the range before the test. It measures stated choice, not behaviour, so it frames the test rather than replacing it.
- The relative-price estimate as a bound, not as the answer. If the test lands far outside -1.7 to -0.1, something is wrong with one of them.
What the brand did: the test, in two retail chains, starting in January. The file that comes back will have a price column that moves, and that is the file the Pricing & Promo path can start from. The next post in this thread is what that looks like when the moves are already in the history.
The lesson
Elasticity is learned from the price moves you have made. A brand that has never moved its price has never asked its shoppers the question, so no model can report their answer. The fix is not a cleverer regression. It is a small, deliberate move, in a place where being wrong is cheap.
The Pricing & Promo Path
- Price elasticity when your shelf price never moved in three years
- Price elasticity of -1.4 and why a 5% price rise still paid
- Promo lift net of pull-forward: the 30% discount that never paid (out October 8, 2026)
- Promo elasticity when you are on promotion 48 weeks a year (out October 13, 2026)
- Cross-price elasticity: which competitor actually takes your volume (out October 18, 2026)
- Cross-elasticity when competitor prices are only monthly (out October 23, 2026)
- Scenario simulation for a promo calendar: the wave worth dropping (out October 28, 2026)