Spanish jarred pasta sauce brand, about €240,000 of weekly sales, asking how much a rival's discount week really took.
A composite case, built from the kind of file we see most weeks: a Spanish brand of jarred pasta sauces selling around 98,000 jars a week through grocery, about €240,000 of weekly retail sales at an average shelf price of €2.45.
The question
In the second week of April the brand's main competitor ran a 30% discount on its whole range at the two largest retail chains. The brand's volume that week fell 8.3% against the week before. The sales director's email the following Monday was short: "They took 8% of our volume in one week. We need to answer with our own promotion next month."
The question brought to us was narrower: how much of that 8% did their discount actually take?
What the file looked like
156 weeks of scanner data. Own volume, own average price, own promotion depth and feature flags, weighted distribution, and the competitor's average shelf price, collected weekly by the brand's own field team.
That last column is what made the case answerable. Over three years the competitor had run fourteen discount weeks, at depths from 15% to 35%, at different times of year and mostly not in the same weeks as the brand's own promotions. That is real variation in their price, separate from variation in ours, and it is what Cross-Elasticity needs.
Two other facts about that April week were sitting in the same file. The week before was Easter week, the strongest of the spring for pasta sauces. And the brand's own in-store feature at the largest chain had ended the same Sunday.
What the analysis did
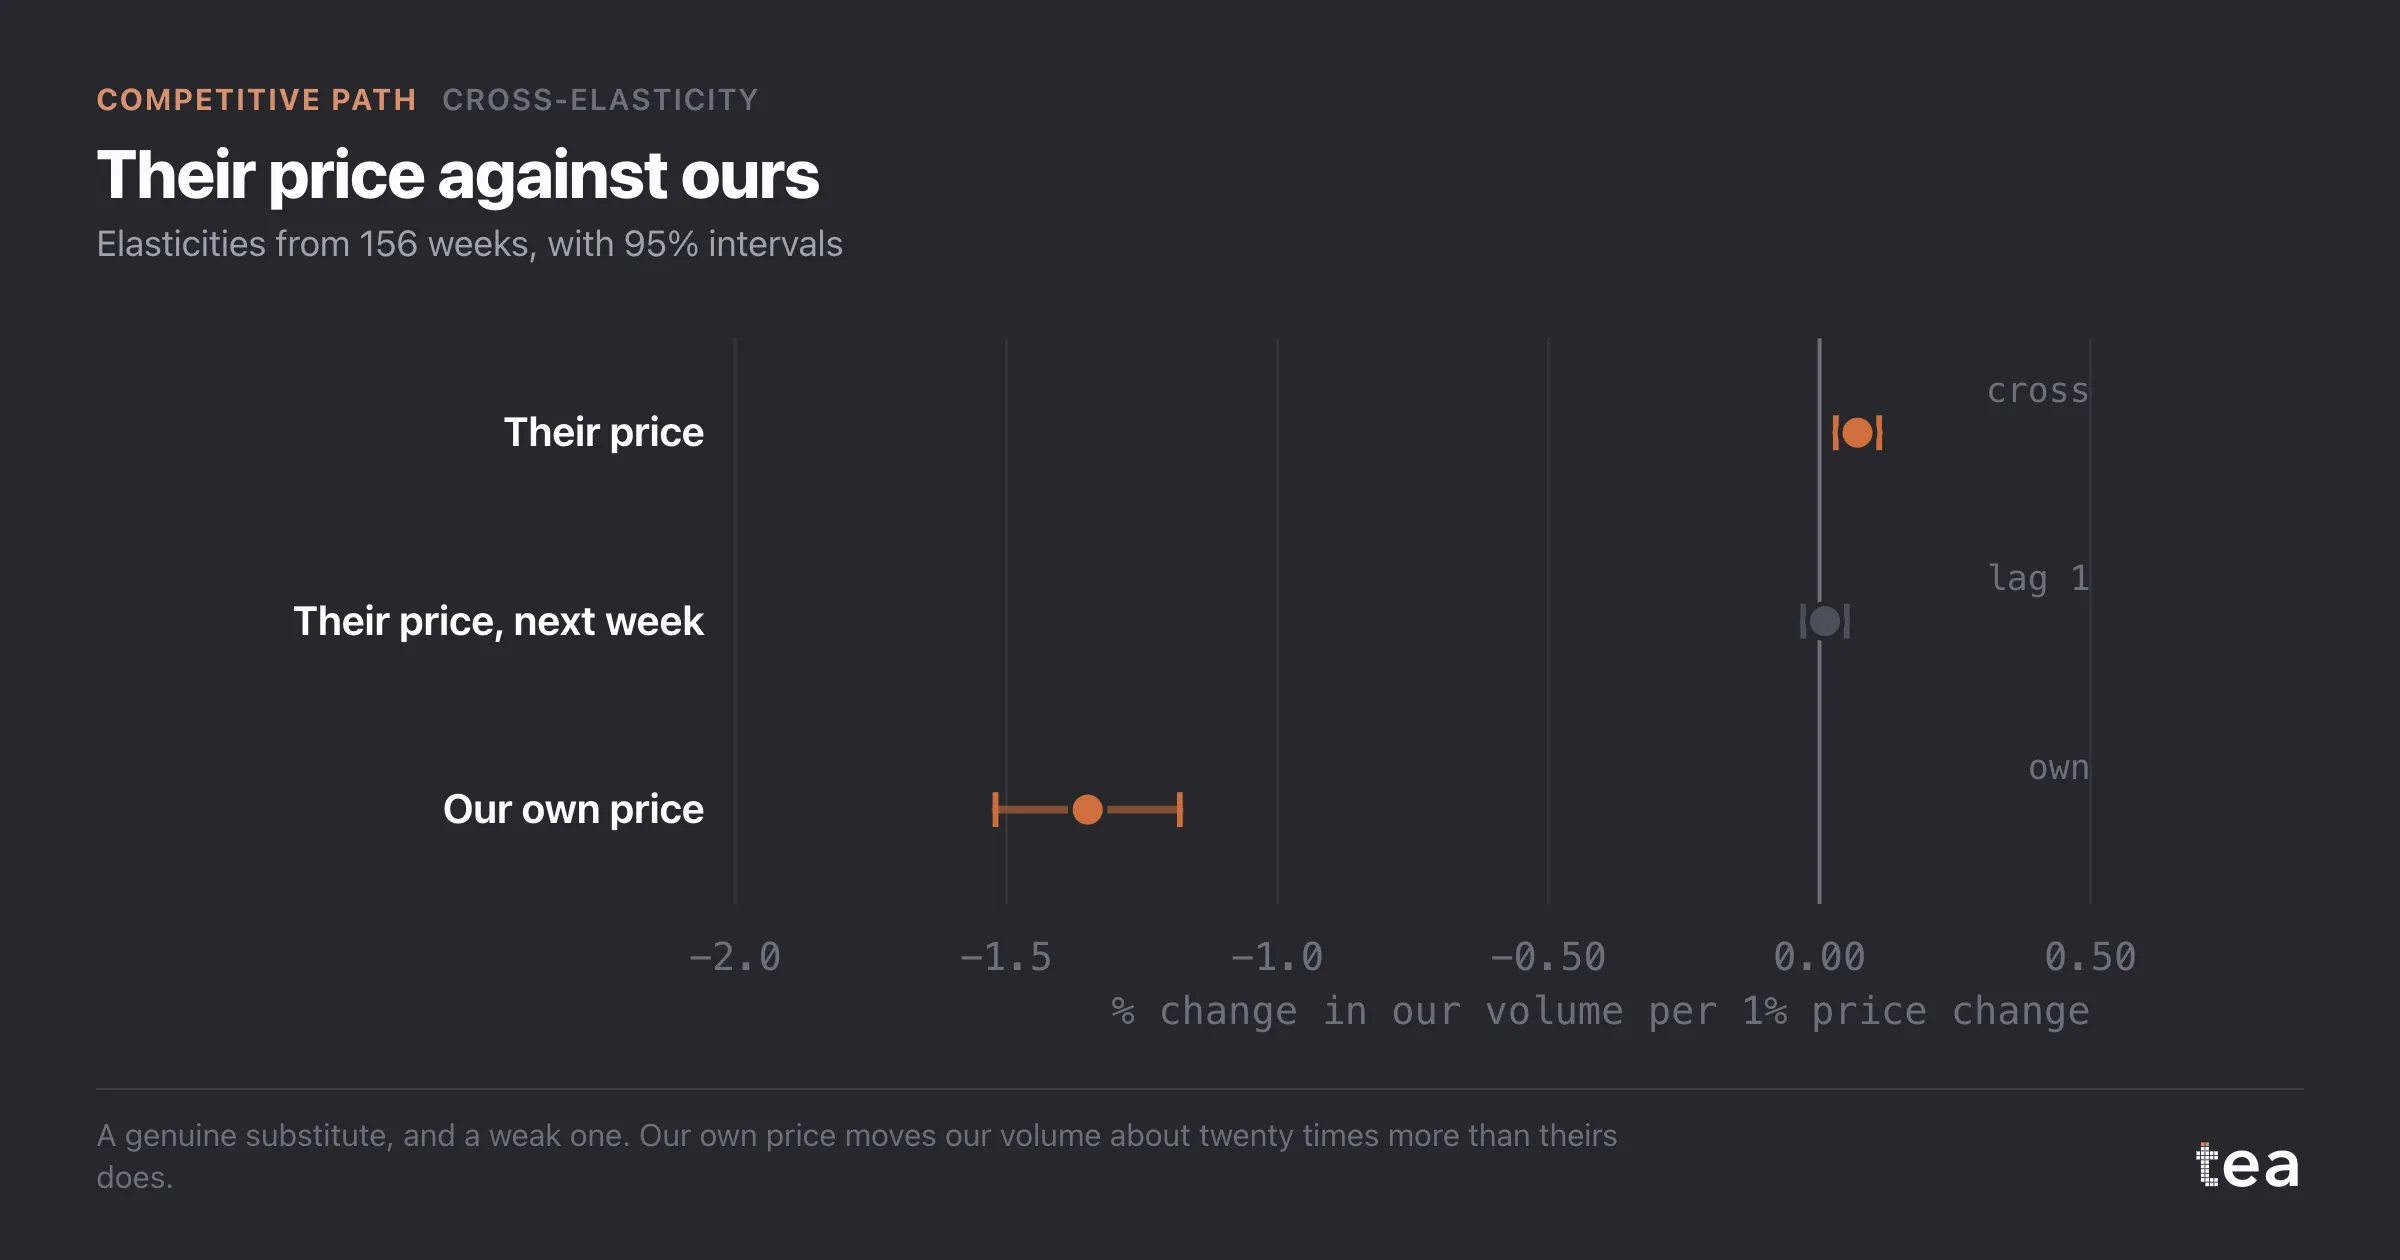
The model is a log-log regression of own volume on own price, competitor price, promotion and feature flags, distribution and a seasonal profile. In that form the coefficient on competitor price is the cross-elasticity: the percentage change in our volume for a 1% change in their price, with everything else held where it was.
It came out at 0.07, with a 95% interval from 0.03 to 0.11. Positive, so the competitor is a genuine substitute. Small, so it is a weak one. The own-price elasticity in the same model was -1.35, which means our own price matters to our volume roughly twenty times more than theirs does.
A 30% cut in their price, multiplied by 0.07, is a 2.1% loss of our volume. The interval puts it between 0.9% and 3.3%.
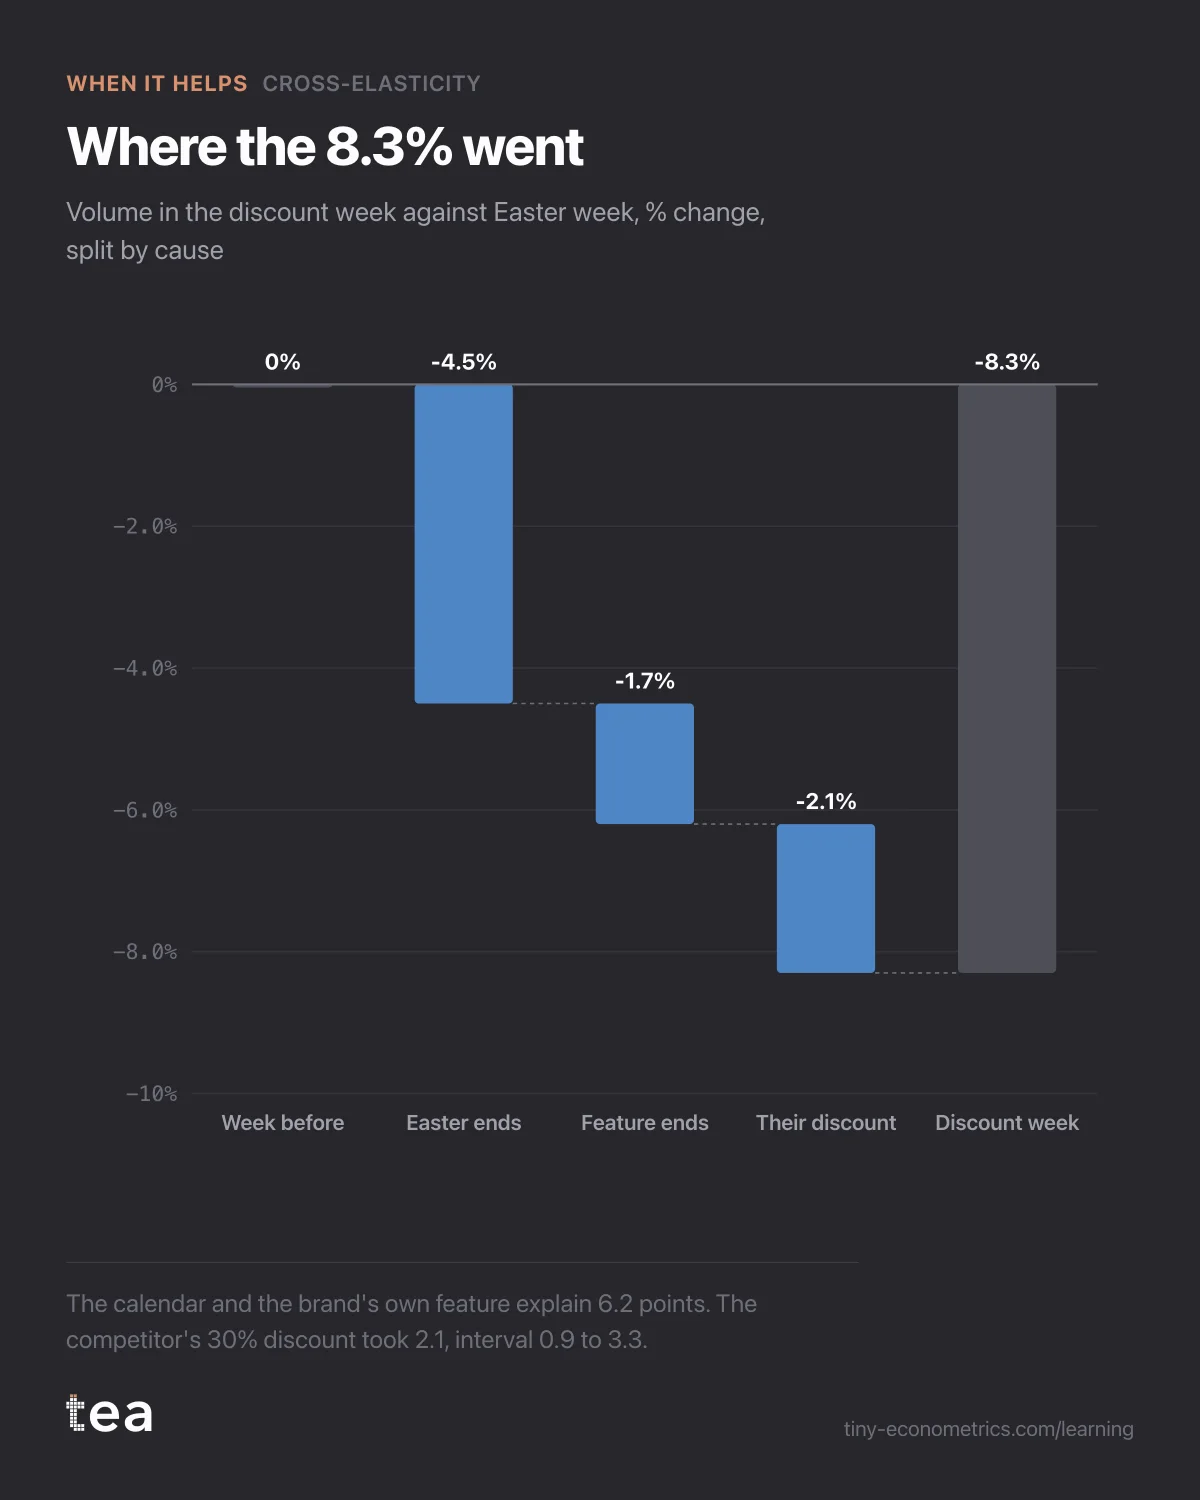
The rest of the 8.3% came apart cleanly once the model held everything else:
- 4.5 points were the return from Easter week to an ordinary April week. The same drop appears in both earlier years, with no competitor discount anywhere near it.
- 1.7 points were the end of the brand's own feature at the largest chain.
- 2.1 points were the competitor's discount.
Before trusting the number we checked the two things that usually break a cross-elasticity. Collinearity: their price and ours had a correlation of 0.18 over the window and variance inflation factors below 1.3, so the two coefficients are separable. And timing: a version with a one-week lag on competitor price found nothing in the following week, so there was no hidden tail of lost buyers.
The verdict: 2.1%, not 8%
The analysis helped, and it changed a specific decision. The planned answer was a 25% discount across the range for two weeks in May, already pencilled into the retail calendar.
At 2.1% of one week's volume, the competitor's discount had cost the brand about 2,060 jars, roughly €5,000 of retail sales and €2,000 of gross margin. Whatever the right answer to that was, it was not two weeks at 25% off. The promotion was suspended until the next question had an answer: what would matching actually buy, at the brand's own measured lift? That is the next step of the Competitive Path, and it gets its own case.
The second change was quieter and probably worth more. The weekly report that produced the 8% compared every week with the week before. From the next month it compared each week with the same week a year earlier and flagged holiday weeks, which removed the most common source of alarm in the sales team's inbox.
There are limits worth stating. The 0.07 is an average across fourteen discount weeks at both chains. A competitor discount deeper than anything in the file, or a permanent price cut rather than a single week, could behave differently, and the model would be extrapolating. And this is the substitution effect on our volume, not a measure of what the discount did for them.
The lesson
A week-on-week drop is the sum of everything that happened that week, and the competitor's move is only the most visible thing in it. Before reacting to their price, separate it from your own calendar and your own promotions. The cross-elasticity is often smaller than the fear, and when it is, the cheapest response is usually none.
tea, the product
Your file, this question
Fifteen analyses on a CSV of weekly data, with the intervals and the diagnostics shown, and a plain sentence when the data cannot answer. Free while in beta, by invitation.
Request a place in the beta→tea, the product
Fifteen econometric analyses on your own CSV: Cross-Elasticity, saturation curves, elasticities, budget allocation. Intervals and diagnostics shown, and a plain sentence when the file cannot answer.
Free while in beta, by invitation.
Request a place in the beta →Liked this? Run it on your own data.
tea runs Cross-Elasticity and fourteen other analyses on any weekly CSV, in minutes. Free while in beta, by invitation.
The Competitive Path
- Excess share of voice: where a challenger brand actually gained
- Share of voice when your monitoring service misses digital spend
- Competitor discount week: 2.1% of our volume, not the feared 8%
- A new entrant after ten weeks: too few to measure cross-elasticity (out October 15, 2026)
- Should we match a competitor's 25% discount? Lift, margin, hold (out October 20, 2026)
- Promotions that always coincide with the rival's cannot be split (out October 25, 2026)
- A lost share point, decomposed: their media, their price, our season (out October 30, 2026)