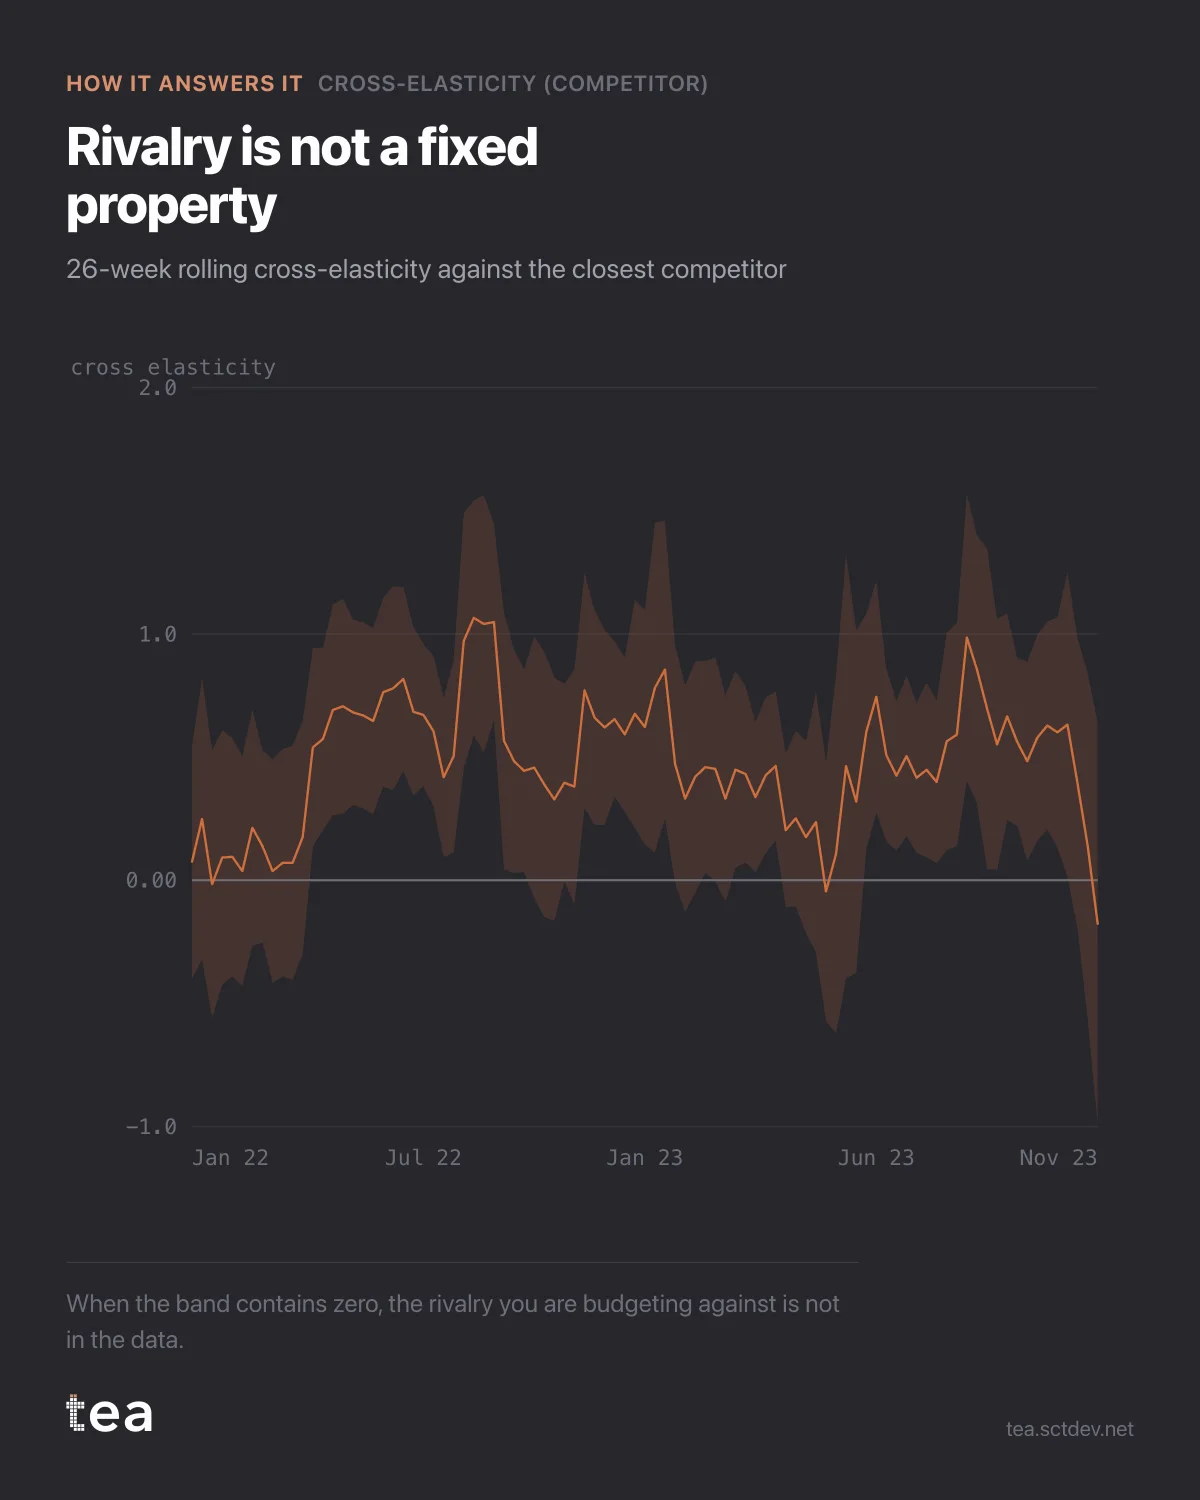
Rivalry is not a fixed property of two brands. It is a measurement of a period, and this is what it looks like when you let it move.
The line is the cross-elasticity against the closest competitor, estimated on a rolling 26 week window. The band is the 95% interval.
The pooled number for the whole six years is 0.49 and it is solid. The rolling version spends long stretches with a band that comfortably contains zero.
Both are true, and the tension between them is the useful part.
A pooled estimate uses all the data, so it has the tightest interval and the most authority. A rolling estimate asks a different question: was this relationship stable, or is the average hiding two different regimes with a change in the middle?
When the band contains zero, the rivalry you are budgeting against is not visible in that window. Sometimes that is a real change, a competitor repositioning or exiting a channel. More often it is that neither of you moved price much in those weeks, so there is nothing for the model to read, and a wide band is the honest response to a quiet market.
That distinction is not cosmetic. If you match a competitor's promotion because of a cross-elasticity measured two years ago, you may be defending against a rivalry that has since dissolved, and the margin you give up is real either way.
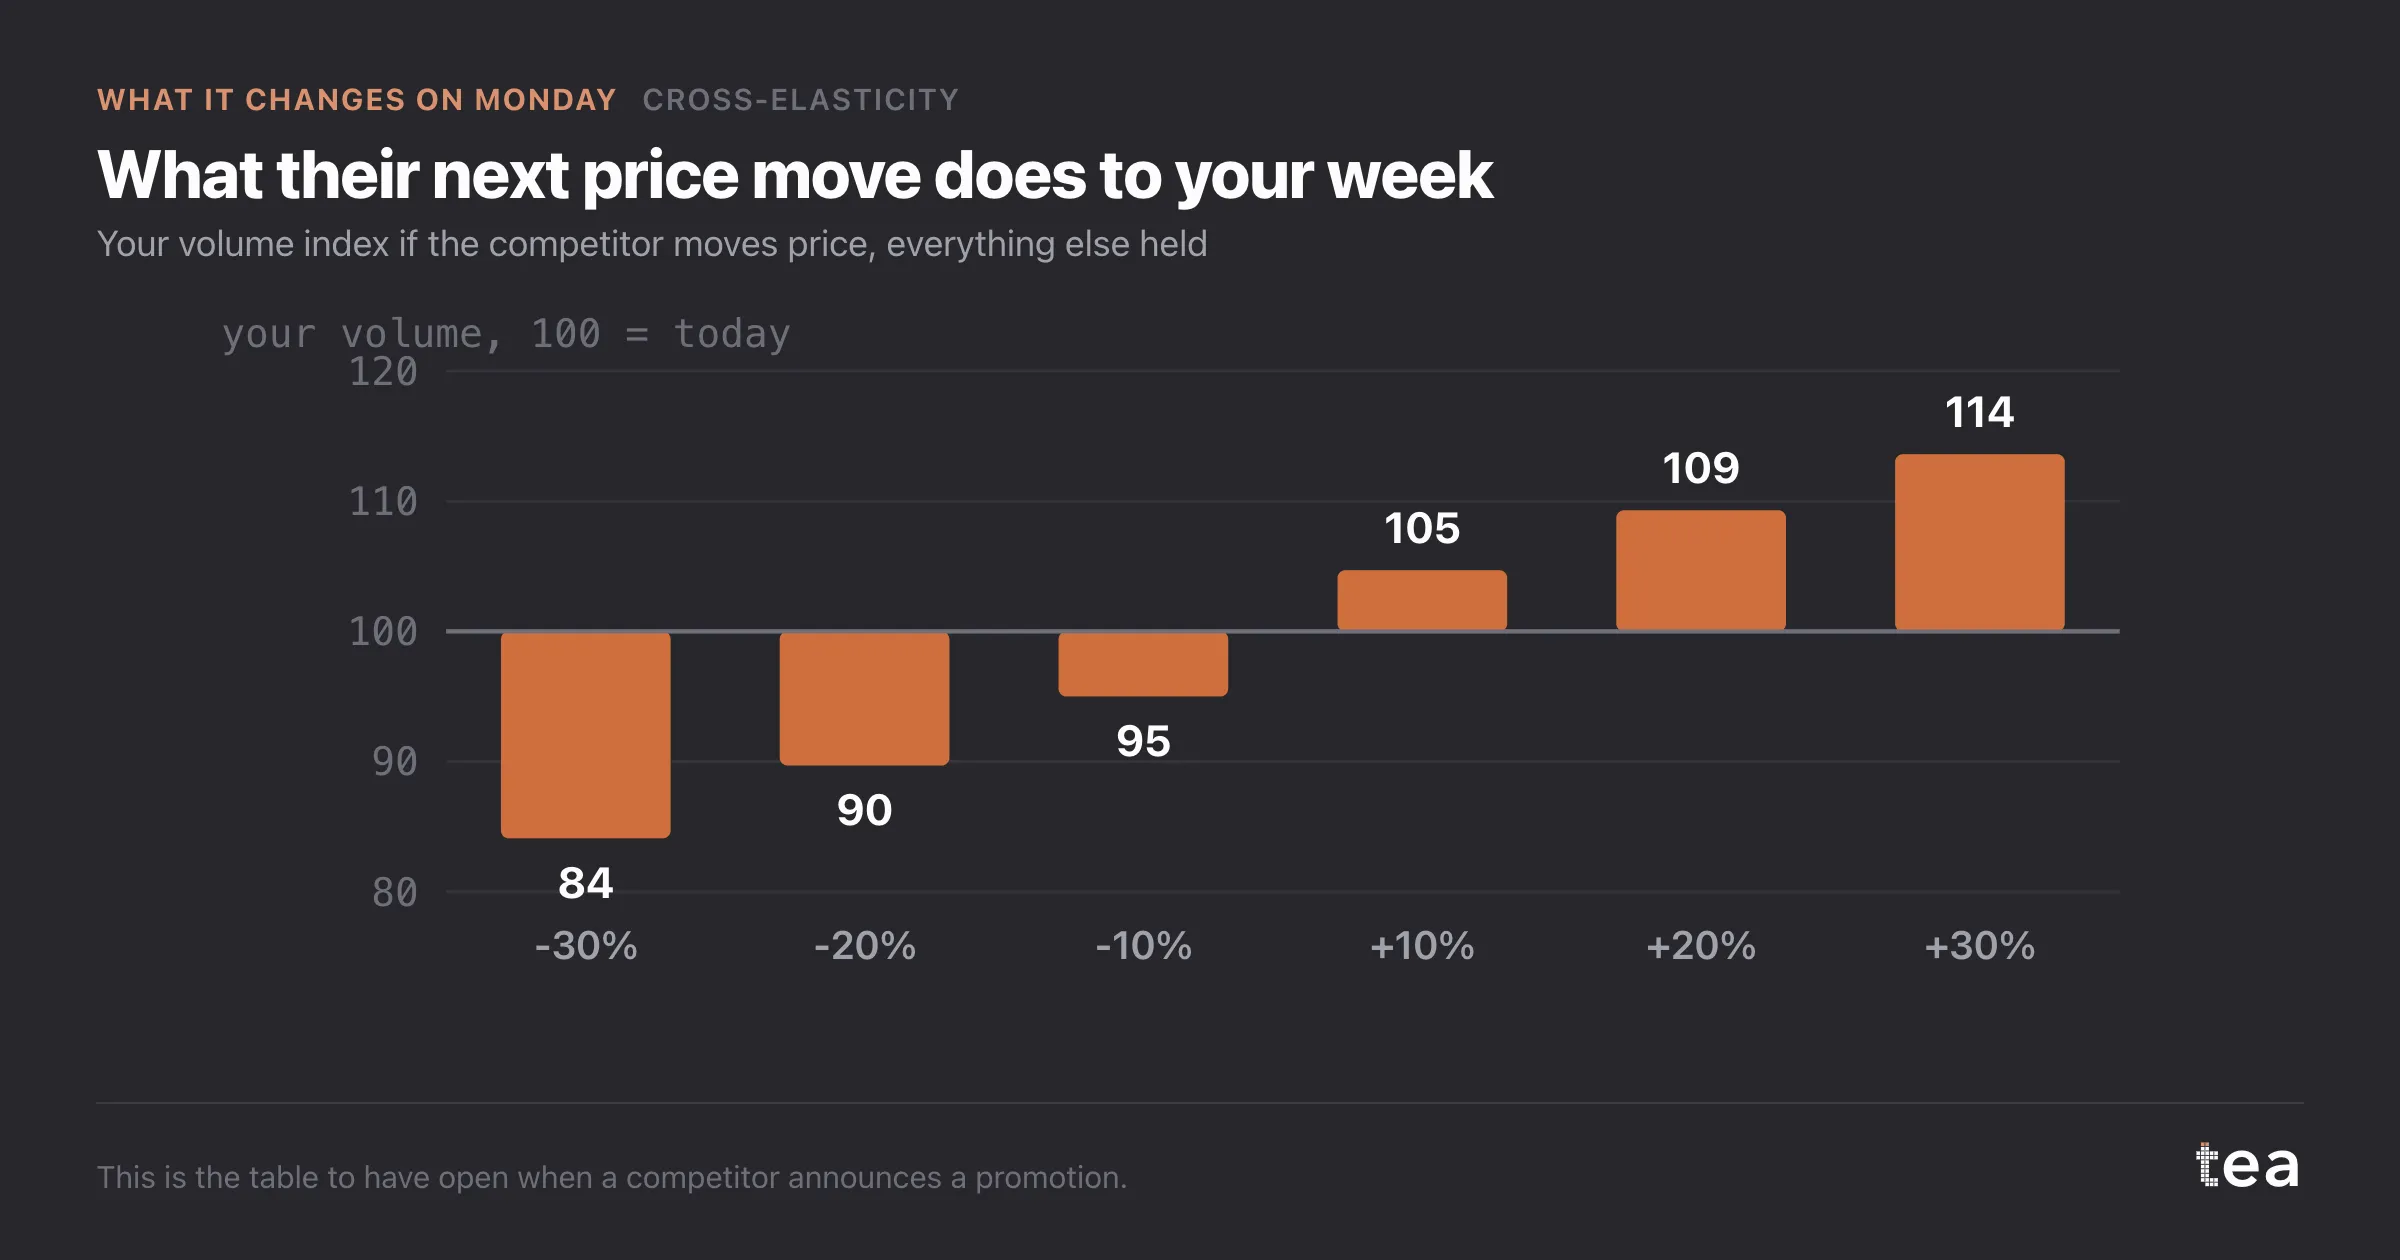
The same logic applies across segments, and this file splits three ways. Retail comes back at 0.68, e-commerce at 0.51, on-trade at 0.24. Same two brands, three very different competitive intensities, because the buyer in a restaurant is not the buyer in a supermarket aisle.
So the practical reading is layered. Use the pooled number for the strategic picture. Use the rolling chart to decide whether it is still current. Use the segment splits to decide where a response is worth making.
And when all three disagree, that is information about the market rather than a problem with the model.
A note on window length, since it decides what you see. Twenty-six weeks is the default here, and it is a compromise: long enough to estimate a cross effect, short enough to notice a change. Halve it and the bands will swallow the line. Double it and you will never see a regime change until it is a year old.
The other habit worth having is to read the rolling chart before quoting the pooled number to anyone senior. If the relationship has changed recently, the pooled estimate is an average of a world that no longer exists, and it will be quoted for the next two years.
The chart is the actual output of Cross-Elasticity in TEA.
tea, the product
Your file, this question
Fifteen analyses on a CSV of weekly data, with the intervals and the diagnostics shown, and a plain sentence when the data cannot answer. Free while in beta, by invitation.
Request a place in the beta→tea, the product
Fifteen econometric analyses on your own CSV: Cross-Elasticity, saturation curves, elasticities, budget allocation. Intervals and diagnostics shown, and a plain sentence when the file cannot answer.
Free while in beta, by invitation.
Request a place in the beta →Liked this? Run it on your own data.
tea runs Cross-Elasticity and fourteen other analyses on any weekly CSV, in minutes. Free while in beta, by invitation.