ea

Analyses/Pricing & Promo Path/Cross-Elasticity

Which competitor actually takes your volume.

Cross-Elasticity measures how your volume moves when a competitor moves its price: one coefficient per competitor, each net of the others and of your own price. It separates the brand that takes your volume from the brand that only sits next to you.

Answers How much of your volume moves when they reprice? Needs Weekly volume, your price, their weekly prices Hands back Cross-elasticity per competitor, scenarios

Two neighbours on the shelf, one rival

elasticity of your volume, with 95% interval
  • Your own price
  • Brand A, a substitute
  • Brand B, interval contains zero
Brand A0.6095% interval 0.45 to 0.75
Brand B0.05interval −0.08 to 0.18, contains zero
Spent matching B€250kfive price-offs in one year

A dry cat food brand in French grocery, from the first example below. A composite case: your file draws its own coefficients, competitor by competitor, with their intervals.

01

What it is for

Most competitive sets are built from who sits nearby and who the sales team worries about. A cross-elasticity is the share of your volume that moves when their price does, and it is rarely the same for two neighbours.

Choosing whom to match

Match the brand whose price actually moves your volume, and stop matching the one whose price does not. Every matched price-off gives margin away on volume you would have sold anyway, so the wrong target is expensive.

Sizing their move before it lands

The scenarios turn their ±10, 20 and 30% into your volume index if you hold your price. It is the table to have open when the announcement arrives, not a week after it.

Choosing where to defend

With a channel or region column, the same competitor comes back per segment. A rival in one channel can be barely present in another, and a national response then defends the wrong ground.

02

How to read it

The top of every result: a badge, four numbers and two charts, here on tea’s wine and spirits sample file, 312 weekly observations across three channels, with two competitors. Read them in this order.

Competitive elasticity analysis Substitute1
Cross-Elasticity ε_cross +0.4862 p-value < 0.0013 R² 76.2%4 Observations 3125

Cross-elasticity scatter

Competitive scenarios

  1. The badge. Substitute, complement or neutral. Substitute: their rise is your gain. Complement: you rise and fall together. Neutral is a band around zero, ±0.10 by default, and the rail lets you move it, so the label follows the threshold you choose.
  2. The cross-elasticity. The per cent change in your volume for a one per cent change in their price. +0.486 means their 10% rise brings you about 4.7% more volume. The 95% interval sits under it, 0.365 to 0.608 here. With several competitors the headline is the first one, and a table in the result gives each, net of the others.
  3. The p-value. Whether a slope this size could come from no relationship at all. Here it is below a thousandth. On the same file competitor B comes back at 0.091 with a p-value of 0.16: a neighbour, not a rival.
  4. The fit, R². How much of the weekly movement in your volume the prices explain together, your own included. It says the model is reasonable, not that every competitor in it matters.
  5. Observations. The weeks the fit used after rows with a missing or non-positive price were removed, with the number of competitors under it. Below 30 the page calls the estimate directional only.

03

Where it sits in the analysis

Cross-Elasticity is the third step of the Pricing & Promo Path, after your own price and your own promotions, because a competitor’s move only matters in proportion to your own: their 10% means little when your own price moves volume twice as hard.

What you carry forward is one cross-price elasticity per competitor. Scenario Simulation then runs the price and promo calendar you are considering against all three elasticities at once.

Also a step of the Competitive Path.

Pricing & Promo Path

  1. Price Elasticity

    How demand answers a price move, with the confidence band and the revenue curve.

  2. Promo Elasticity

    The incremental lift of the promotions, net of the demand that was coming anyway.

  3. Cross-Elasticity this page

    Whether the competitor move takes your volume or leaves it alone.

    Carries forward: cross-price elasticity

  4. Scenario Simulation

    The price and promo calendar you are considering, run against all three elasticities at once.

04

Where it usually misleads

The regression is the same as for your own price. The problems are in the competitor columns: how often they were collected, whether they moved, and whether they moved apart.

Your own price left out

A brand that matches a rival within the fortnight moves its own price in the same weeks as the rival’s. Leave your own price out and the rival’s coefficient absorbs what your matching did, so a neighbour looks like a threat.

Add your own price column: it goes into the same regression, and your own elasticity is printed beside the competitors’, with its interval.

Two competitors who move together

When the leader and the private label rise in the same months by similar steps, the model sees one movement, not two. It can say the shelf matters and cannot say which half of it. Second example below.

All competitors sit in one regression, so each coefficient is net of the others and its interval widens when they move together. When every interval crosses zero, combine them into one shelf price and plan on that.

A competitor price that never moved

A new entrant at its launch price for ten weeks is a switch for “on the shelf”, not a price. There is no co-movement to read, and any elasticity forced out of it is an assumption with decimals.

A competitor whose price never moves is left out of the results rather than given a number, and when no competitor price moves the run stops and says so.

Monthly prices beside weekly volume

A price scraped on the first Monday of each month repeats for four or five weeks and misses every promotion in between. That is measurement error in a driver, and it pulls the coefficient towards zero while widening it.

Collect competitor prices at the grain of your own data, weekly for a weekly file, before you run it. A repeated monthly value is not a lighter version of a weekly one.

A week-on-week drop blamed on them

Volume fell 8.3% in the week of a rival’s discount. Measured, 4.5 points were the return from Easter week, 1.7 the end of the brand’s own feature, and 2.1 the rival. The competitor’s move is only the most visible thing in a week.

Cross-Elasticity has no season term of its own. Compare each week with the same week a year earlier, and run Seasonality & Event Impact first when a holiday sits next to their move.

One rivalry for six years

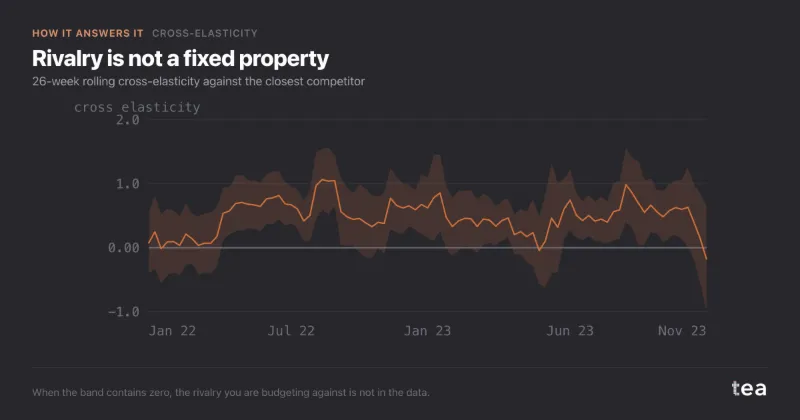
Rivalry is a measurement of a period. On tea’s sample the pooled 0.49 is solid, and the rolling estimate spends long stretches with a band that contains zero. The same competitor reads 0.68 in retail and 0.24 on-trade.

Every result carries a rolling cross-elasticity with its 95% band, and a segment breakdown when the file has a channel or region column.

05

Two examples

One file where the analysis changed a decision, one where it could not answer. Both are useful results.

Helps

The neighbour that was never a rival

A dry cat food brand in French grocery, about 25,000 bags a week at €9.90, had a rule: when Brand B, the slightly more premium bag next to it on most shelves, cut its price, match it within the fortnight. Last year that meant five price-offs at 15%, each costing about €50k of gross margin.

Three years of weekly prices, with Brands A and B moving at different times, correlated at 0.31. Brand A came back at 0.6, interval 0.45 to 0.75: a substitute. Brand B at 0.05, interval −0.08 to 0.18, which contains zero. A 10% cut by A takes about 6.1% of the brand’s volume, the same cut by B about 0.5%. The brand stopped matching B, and volume held flat within half a per cent.

A 10% cut, by each brand

% change in your weekly volume, with 95% interval

One of the two cuts is worth an answer. Answering the other cost €250k in a year.
Does not help

Two competitors who always moved together

An olive oil brand, third in Italian grocery, asked who takes its volume: the brand leader or the private label. The private label’s price came weekly; the leader’s was scraped on the first Monday of each month and repeated. Through the winter all three prices rose together, and the two competitors were correlated at 0.94.

Separately, the leader came back at 0.9, interval −0.6 to 2.4, and the private label at 0.3, interval −1.2 to 1.8. Both cross zero, and the ordering of the two is close to a coin toss. Combined into one shelf index, the answer was solid: 1.1, interval 0.8 to 1.4. The brand bought weekly competitor prices and will ask again in a year.

Apart, two guesses. Together, one answer

cross-elasticity on your volume, with 95% interval

Each interval on its own holds any story in the room. The combined one is narrow enough to plan on.

06

What the charts add to the numbers

A cross-elasticity is one number per competitor, and a competitive response needs three readings of it: whether the slope is there, what their move costs you, and whether the rivalry is still current.

Cross-elasticity scatter

competitor A’s price against your weekly volume
  • A week
  • Fitted volume

Reads as: whether the slope is real. Each dot is a week, the line is the fit, and its slope is the cross-elasticity. A cloud with a tilt is a rival; a cloud with none is a neighbour, however close it sits on the shelf.

Competitive scenarios

your volume if they move and you do not

Reads as: what their move costs you if you hold your price. A 30% cut by competitor A takes about 16% of the volume, a 10% cut about 5%. It is in volume, so convert both sides to margin before anyone decides to match.

Rolling cross-elasticity

windows of 26 periods, with the 95% band
  • Rolling cross-elasticity
  • 95% band

Reads as: whether the rivalry is still current. The pooled 0.49 uses every week and is solid; the rolling line spends long stretches with a band that contains zero, often where neither brand moved its price much. Read it before quoting the pooled number to anyone senior, because a rivalry measured two years ago may have dissolved since.

tea, the product

Find out which competitor takes your volume

A CSV with a date, your volume, your price and theirs. A cross-elasticity per competitor, its interval and the scenarios, in minutes, and a plain sentence when their price never moved. Free while in beta, by invitation.

Request a place in the beta

tea, the product

Fifteen econometric analyses on your own CSV: Cross-Elasticity, saturation curves, elasticities, budget allocation. The diagnostics shown, and a plain sentence when the file cannot answer.

Free while in beta, by invitation.

Request a place in the beta →

Now run it on your own data.

tea runs Cross-Elasticity and fourteen other analyses on any weekly CSV, in minutes. Free while in beta, by invitation.

Join the beta