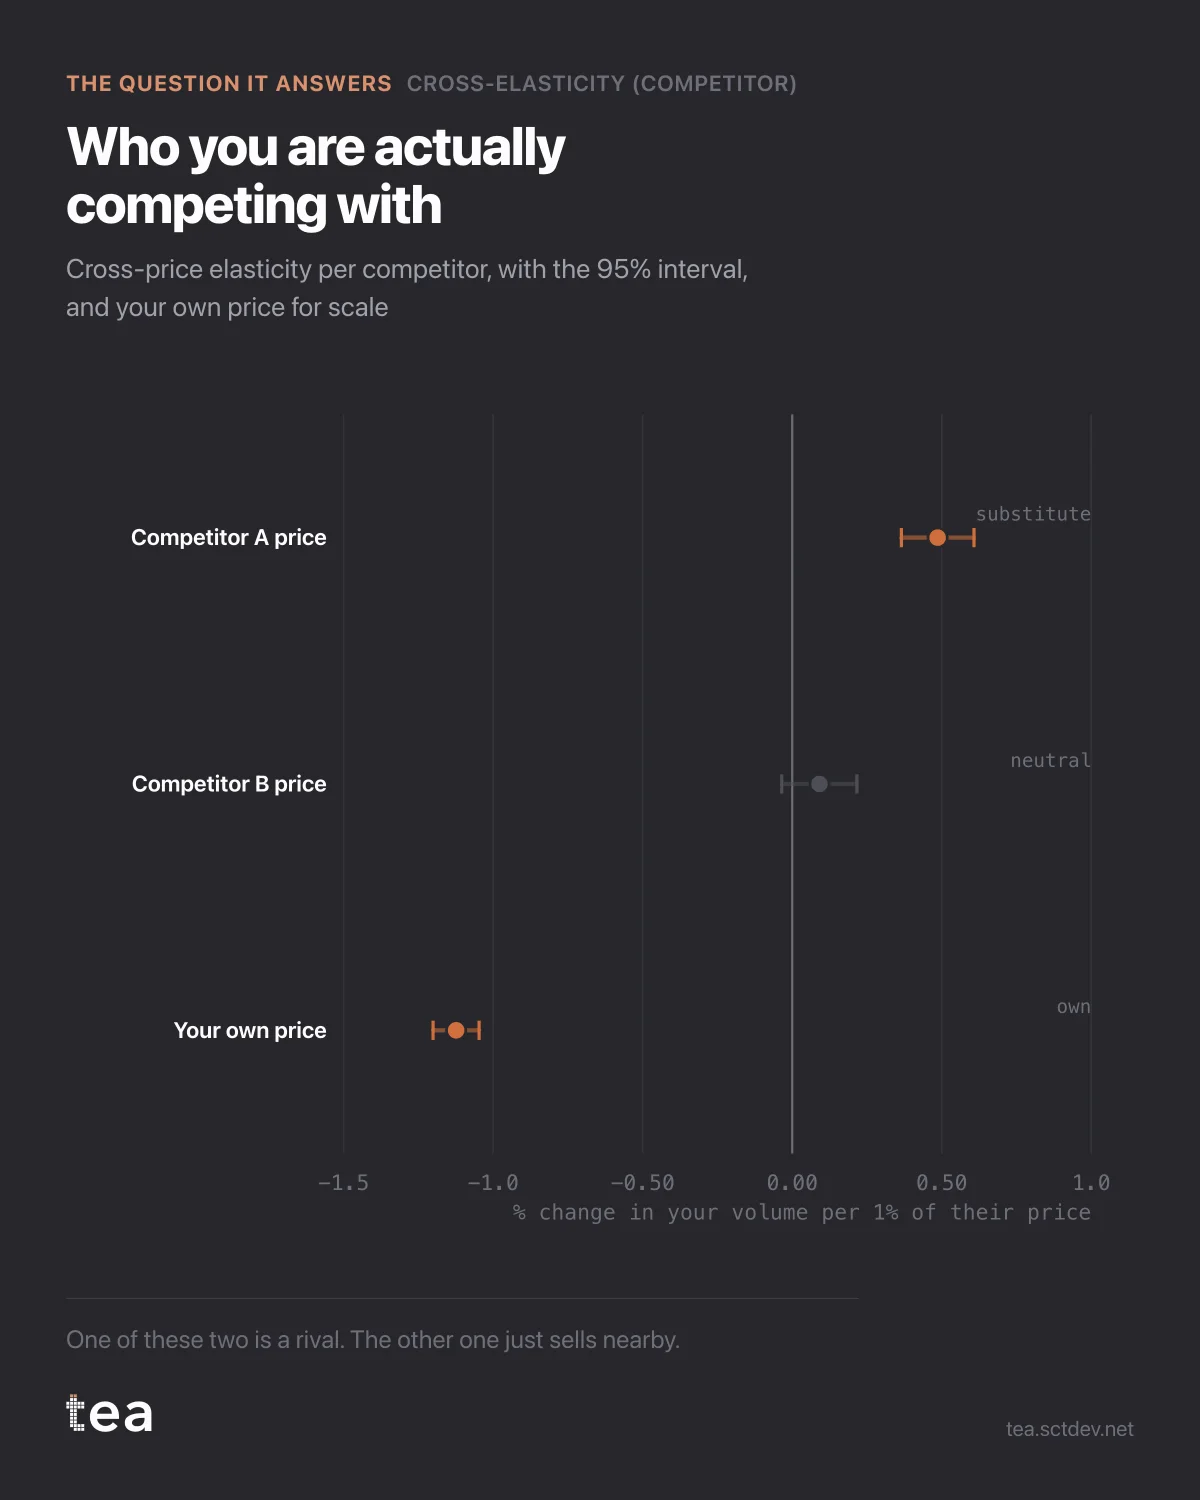
Two competitors on the shelf next to you. One of them is a rival. The other one just sells nearby, and this chart is how you tell them apart.
Competitor A: cross-elasticity 0.49, with a 95% interval from 0.37 to 0.61. When their price goes up 1%, your volume goes up about half a percent. That is a substitute, and it is the brand you are actually competing with.
Competitor B: 0.09, interval from -0.04 to 0.22. The interval contains zero. Their price moves do not measurably touch your volume, and no amount of strategy deck will change that.
Your own price elasticity is on the same chart for scale: -1.12, with a tight interval.
Put those three numbers side by side and a positioning argument becomes an arithmetic one. Your own price is roughly twice as powerful on your volume as competitor A's price, and competitor B is not in the conversation at all.
Most competitive sets are assembled from category knowledge, sales force anecdote and who the brand team worries about. Some of that is right. The part that is wrong is expensive, because it sets the price you match, the promotions you follow and the share of voice you chase.
Two things the model needed to produce this cleanly.
Your own price in the specification. Without it, a competitor's price absorbs whatever your own pricing did in the same weeks, and the cross effect comes back inflated.
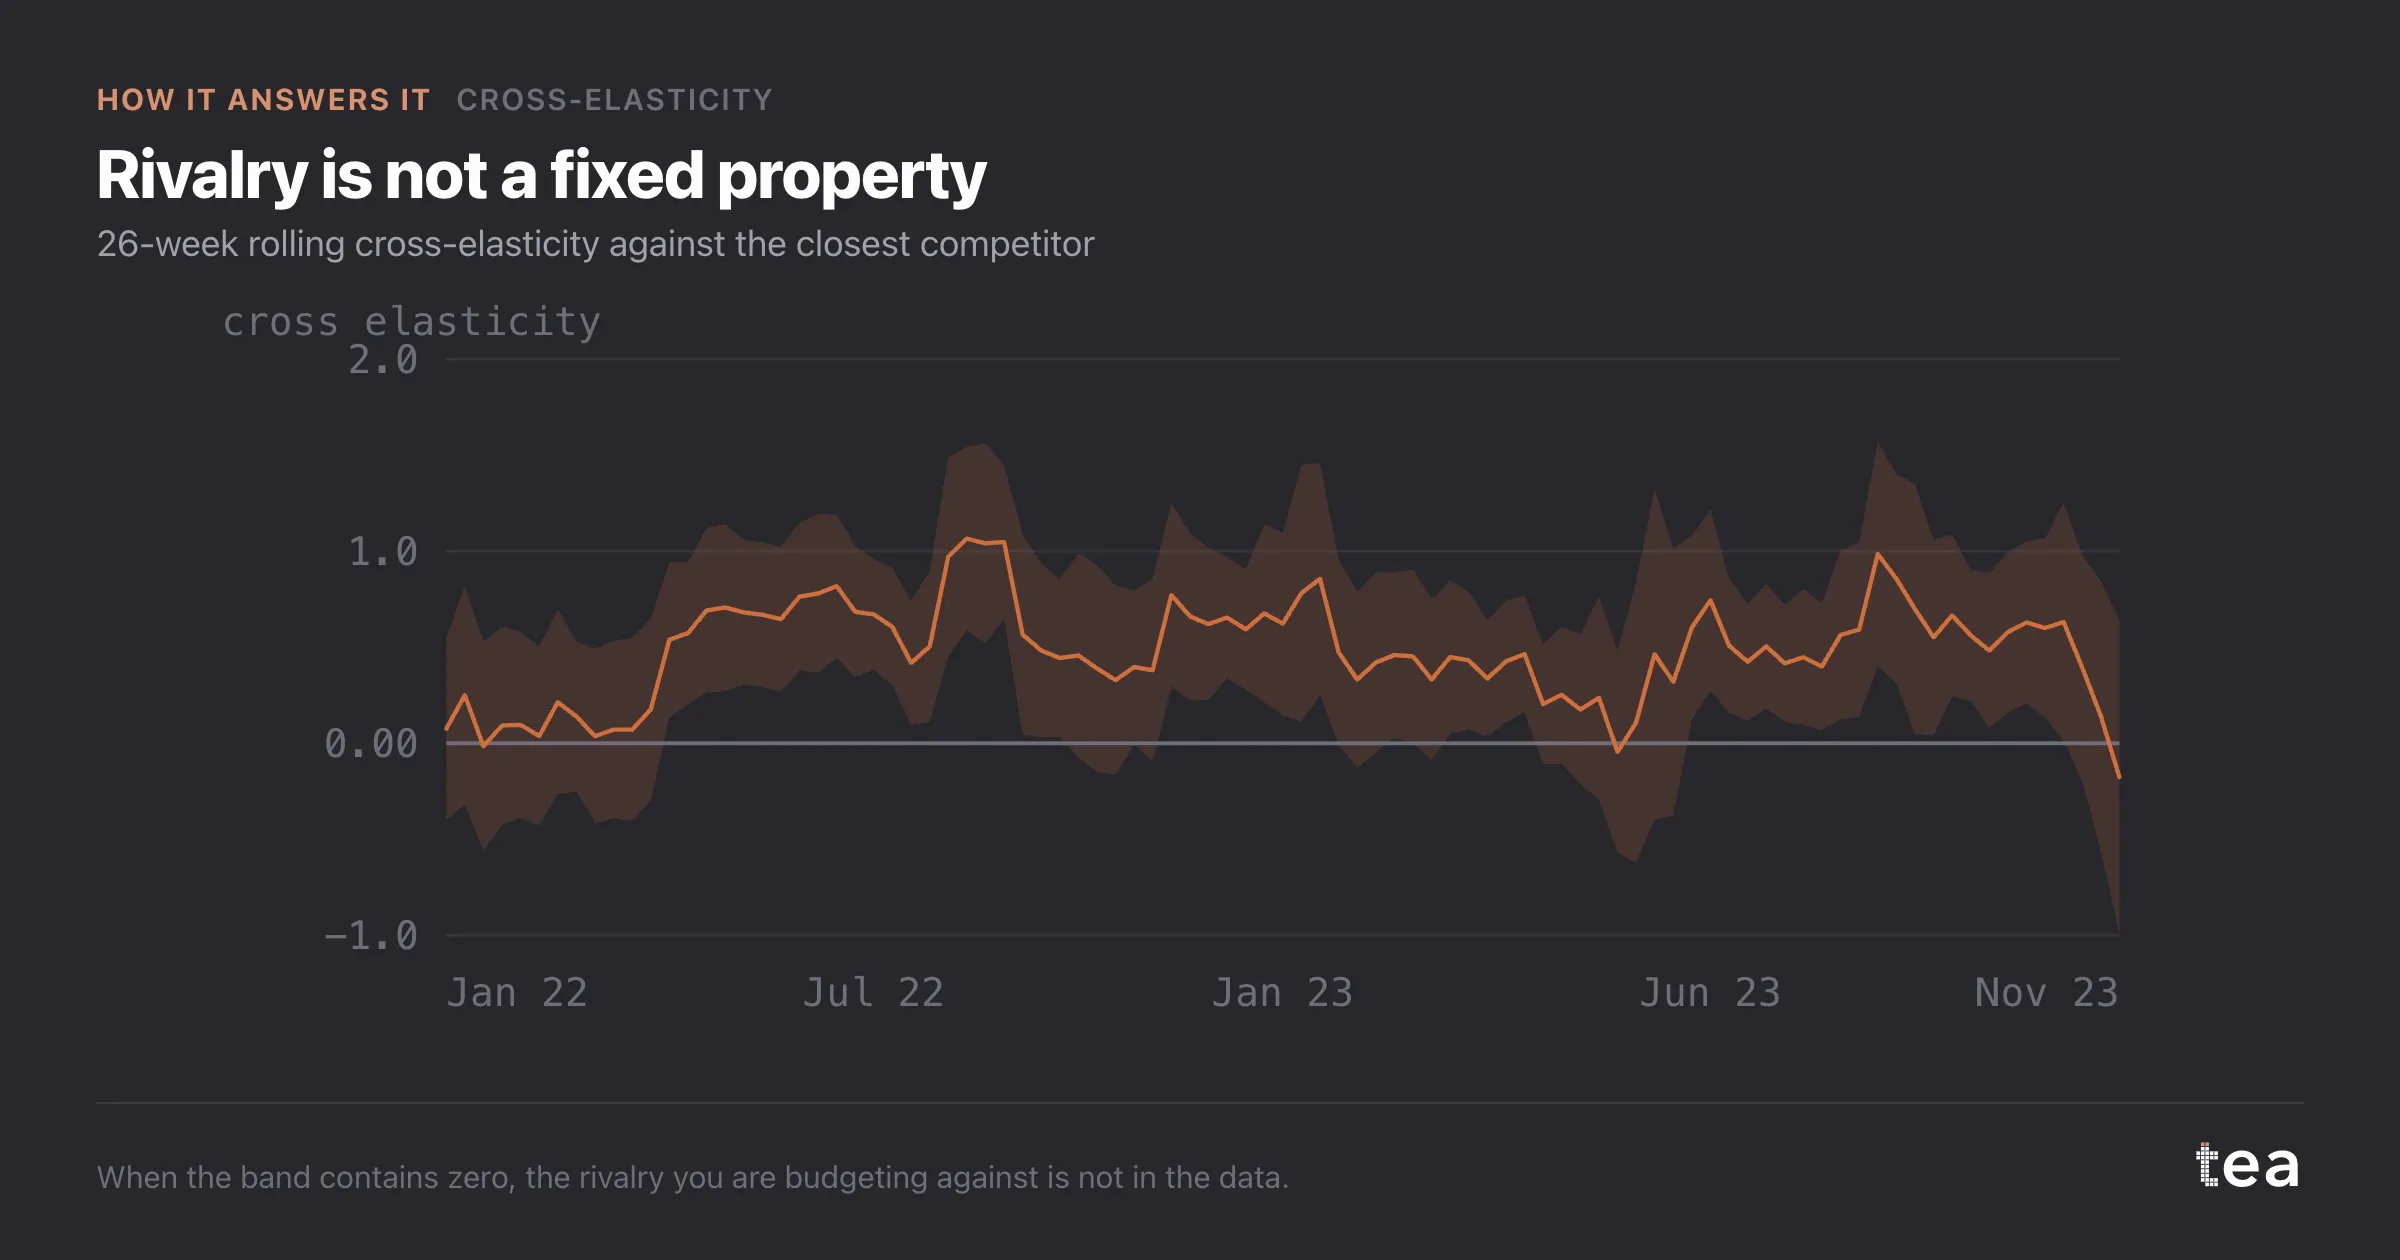
And a collinearity check. When two competitors price in lockstep, their coefficients trade places and neither number means anything on its own. The VIFs here are close to 1, so the estimates are separable, and TEA prints them rather than assuming.
What changes once the competitive set is measured rather than assumed:
Price matching gets a target. You match the brand whose price actually moves your volume, and you stop matching the one whose does not. On this file that is a straightforward saving.
Share of voice gets a denominator. The category is not the competitive set. If only one of two neighbours is a substitute, your voice competition is with one brand, not with the whole shelf.
And the segment splits change where you defend. Retail comes back at 0.68, e-commerce at 0.51, on-trade at 0.24. The same competitor is a serious rival in one channel and barely present in another, which is an argument for a channel specific response rather than a national one.
The input is ordinary: weekly quantity, your price, their prices. The prices are usually the hard part to collect, and they are the reason this analysis is rarer than it should be.
The chart is the actual output of Cross-Elasticity in TEA, run on a sample file anyone can download.