UK biscuit brand, about £54M a year, asking whether to match a rival's deeper promotion in retailer event weeks.
A composite case, built from a pattern that is common in grocery: a UK biscuit brand with about £54M of annual retail sales, competing mainly against one rival brand of similar size across four large chains.
The question
The rival had announced a deeper promotion for the autumn event weeks, a third off instead of its usual quarter. The brand's category manager wanted the arithmetic the pasta sauce case produced: "What does our promotion actually lift, and if they go to a third off, does matching pay?"
What the file looked like
104 weeks of data, aggregated nationally. Own volume, own price, promotion depth, the rival's price and the rival's promotion depth.
On paper it looked richer than most. The brand had run 18 promotional weeks in two years, at depths from 20% to 33%. The rival had run 19.
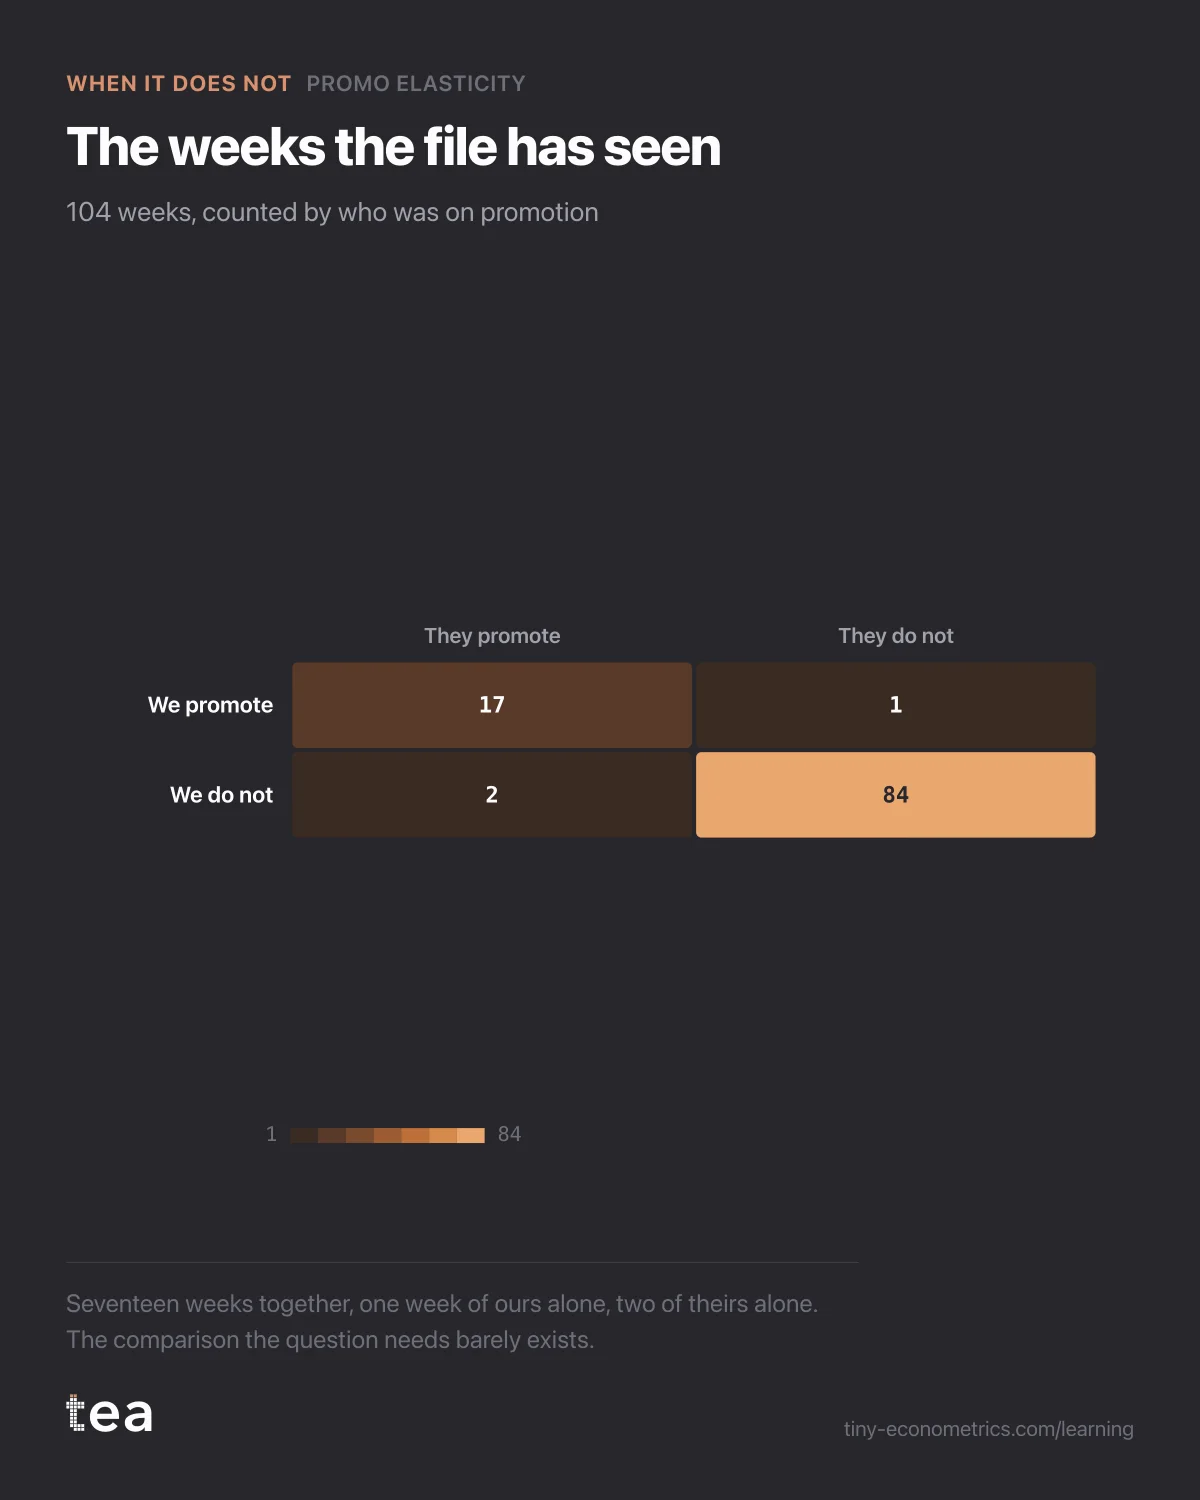
Then we put the two calendars side by side. Of the brand's 18 promotional weeks, 17 were also rival promotional weeks. In 84 weeks neither brand was on promotion. In one week only we were, and in two weeks only they were.
This is not a coincidence. In this category the retailers run the calendar. Event weeks are sold to suppliers as a package, and both brands buy in because staying out means losing the end of the aisle. The calendar the brand thinks of as its promotional plan is mostly the retailer's.
What the analysis could not do
Promo Elasticity estimates the lift of a promotion by comparing weeks with and without it, holding everything else. Here everything else includes the rival's promotion, and the rival's promotion was there in 17 of our 18 weeks. The model has almost no weeks in which to tell the two effects apart.
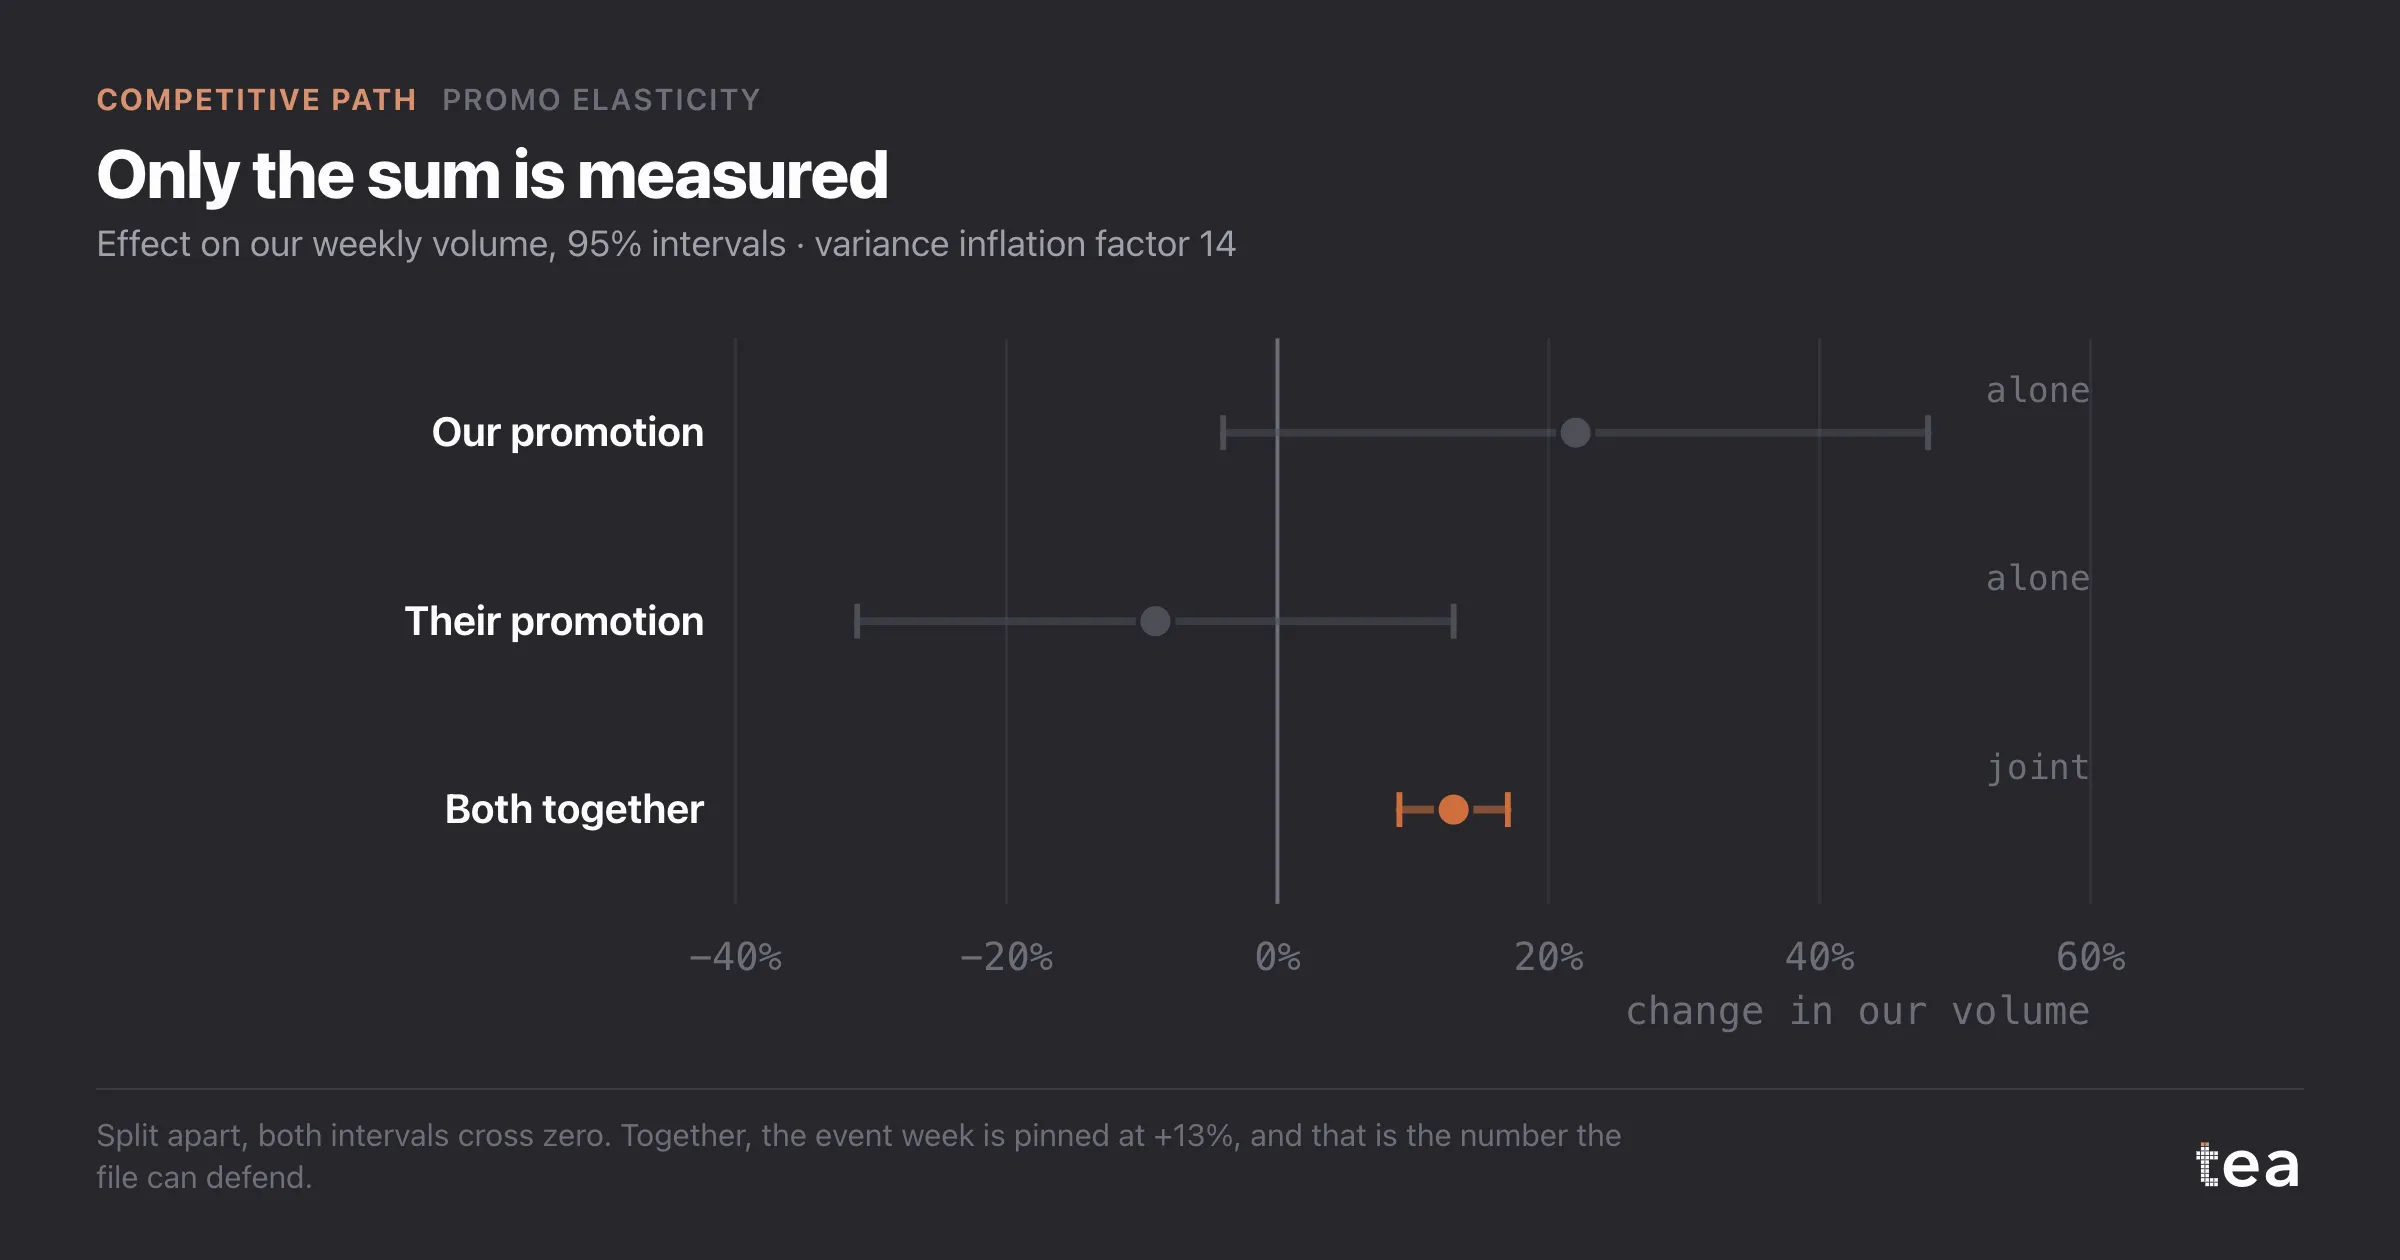
The tool showed this rather than hiding it. The variance inflation factor on own promotion depth was 14, far above the level where coefficients become unstable. The separate estimates came back as:
- our own promotion: +22%, with a 95% interval from -4% to +48%;
- the rival's promotion, on our volume: -9%, with an interval from -31% to +13%.
Both intervals cross zero. Neither number means anything on its own: the model can move weight from one to the other almost freely and fit the data equally well. What it could pin down was their sum. In a week when both brands were on promotion, the brand sold 13% more than in an ordinary week, with an interval from 9% to 17%. Seventeen weeks of the same situation are enough to measure that situation.
The question asked about different situations. Matching or not matching means comparing a week when only they promote with a week when both do, and the file had two weeks of the first kind. That is not a sample. It is an anecdote with dates.
Had we forced a split, the usual tricks would have been to drop the rival from the model, which hands their effect to our lift and distorts it, or to impose a prior from another category, which returns the answer the prior already contained. Either would have produced a tidy break-even calculation. Neither would have been a measurement, and the decision would have rested on whichever assumption we happened to pick.
What to do instead
The useful number was already there: the joint 13%. It answers the question the retailer actually asks, which is whether you are in the event or not. At a third off and a 38% gross margin, a 13% joint lift loses money on every promoted week. That was worth knowing on its own, and it moved the conversation from matching the rival to the terms of the event.
For the question that was asked, the file needs weeks it does not have. We suggested three things.
- Create the missing cell on purpose. Skip one event at one chain, or run one promotion off the retailer's cycle at another, and record it. Two or three such weeks a year start to separate the two effects.
- Use the chains rather than the national total. Event calendars differ slightly by chain. Chain-level data may already hold more unmatched weeks than the national aggregate shows.
- Negotiate funding before depth. If the real decision is whether to be in the event, the lever is who pays for the discount, not how deep it goes.
The brand stayed in the autumn event at its usual depth, did not match the deeper offer, and agreed with one chain to sit out the January event as a deliberate test. That single week will be worth more to the next run than another year of matched calendars.
The lesson
Two effects that always happen together cannot be measured apart, however good the model. Before asking what your promotion does when theirs is on, check whether the file has ever seen the two separately. When it has not, measure the situation you are actually in, and create the other one on purpose. The Competitive Path depends on that variation at every step.
tea, the product
Your file, this question
Fifteen analyses on a CSV of weekly data, with the intervals and the diagnostics shown, and a plain sentence when the data cannot answer. Free while in beta, by invitation.
Request a place in the beta→tea, the product
Fifteen econometric analyses on your own CSV: Promo Elasticity, saturation curves, elasticities, budget allocation. Intervals and diagnostics shown, and a plain sentence when the file cannot answer.
Free while in beta, by invitation.
Request a place in the beta →Liked this? Run it on your own data.
tea runs Promo Elasticity and fourteen other analyses on any weekly CSV, in minutes. Free while in beta, by invitation.
The Competitive Story
- Excess share of voice: where a challenger brand actually gained
- Share of voice when your monitoring service misses digital spend
- Competitor discount week: 2.1% of our volume, not the feared 8%
- A new entrant after ten weeks: too few to measure cross-elasticity
- Should we match a competitor's 25% discount? Lift, margin, hold
- Promotions that always coincide with the rival's cannot be split
- A lost share point, decomposed: their media, their price, our season (out October 30, 2026)