UK mattress brand, about £38M a year, asking whether a 30% share of voice meant it could cut £1M of media.
A composite case, built from files we see more often than we would like: a UK mattress brand selling mostly direct, about £38M of annual revenue, in a category of five brands where it holds roughly 17% of value share.
The question
"Our share of voice is 30% and our share of market is 17%. Are we overspending, and can we cut £1M without losing share?"
It is a fair question, and it is exactly the kind Competitive Pressure is built to answer. The challenger in the previous case asked a version of it and got a usable answer. This brand did not, and the reason was in the first column of the file.
What the file looked like
Twenty-four months, one row per brand per month, 120 rows. Sales value from a panel that covers online and retail. Spend for the four competitors from a media monitoring service. Spend for the brand itself from its own finance system.
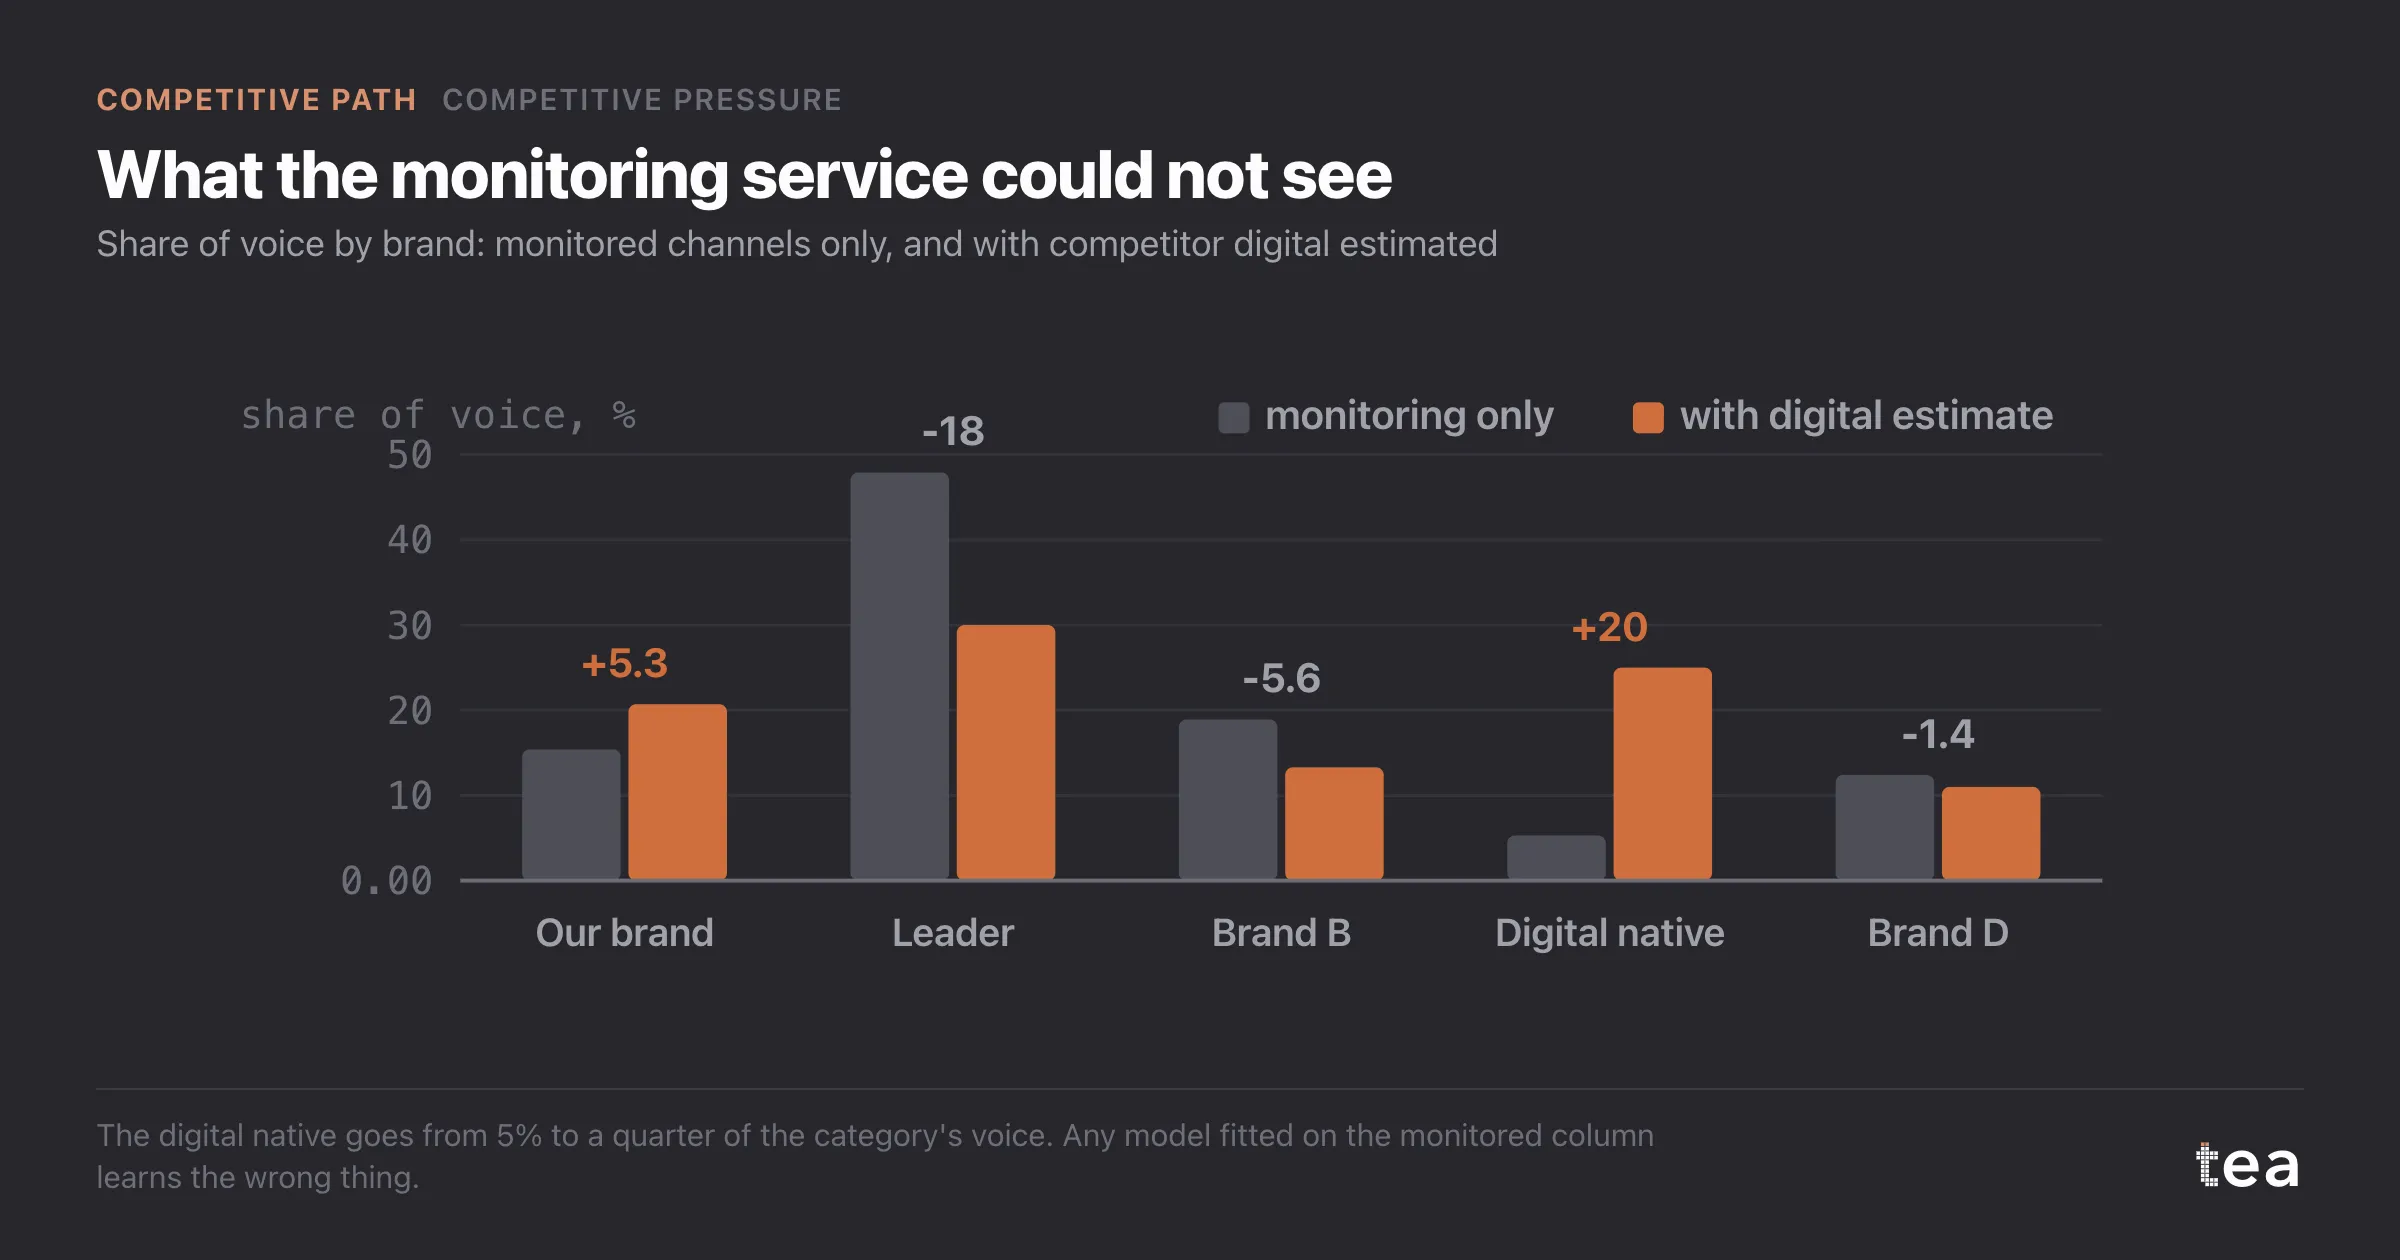
The monitoring service tracks TV, radio, press, outdoor and cinema. It does not track paid social, paid search, programmatic online video or affiliate fees. In this category that gap is not a rounding error. The brand itself spent 58% of its £6.2M budget in digital channels. One competitor, a digital native launched four years earlier, appeared in the monitoring data with £0.9M a year, roughly the cost of a single outdoor flight.
So the file compared the brand's full spend, digital included, with its competitors' offline spend only. Put £6.2M against £14.3M of monitored competitor spend and you get a share of voice of 30%. That is where the number in the question came from.
What the analysis could not do
The arithmetic of share of voice is simple: your spend over everyone's spend. The analysis does it correctly with whatever it is given. The problem is that there were three defensible ways to fill the column, and each described a different brand.
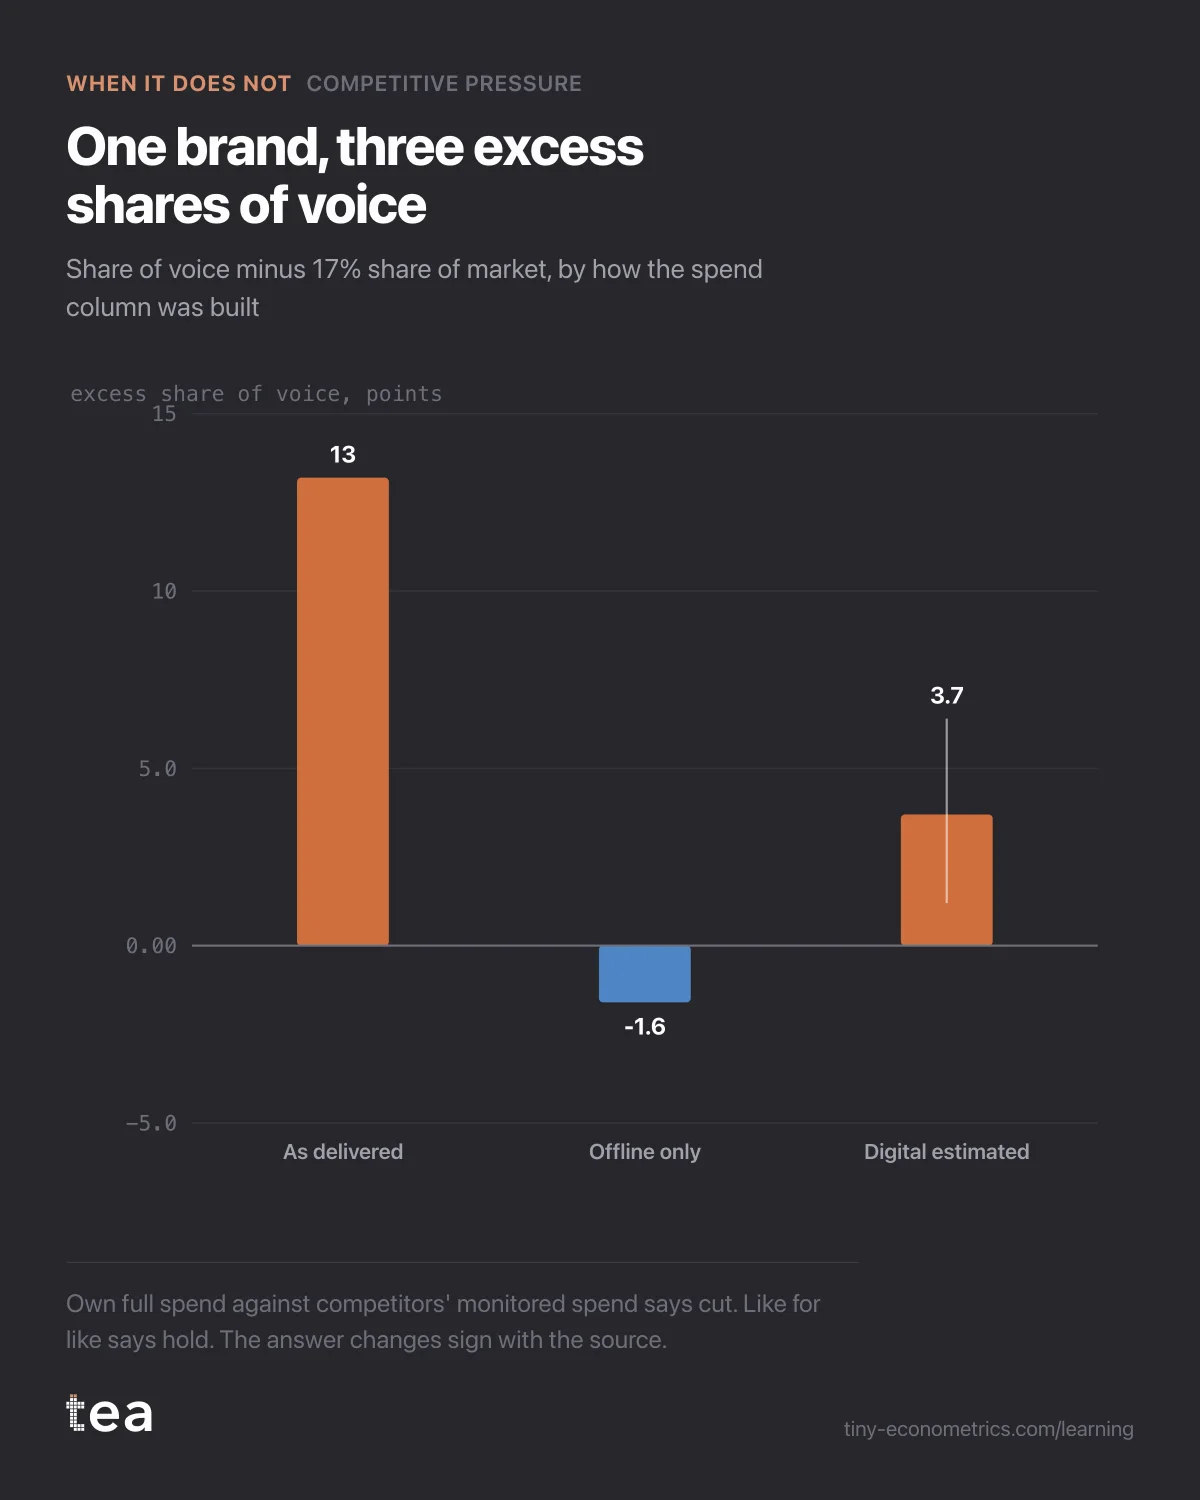
- As delivered: own total spend against competitors' monitored spend. Share of voice 30.2%, an excess of +13 points. Verdict: overspending, cut.
- Like for like, offline only: both sides measured by the monitoring service. Share of voice 15.4%, an excess of -1.6. Verdict: slightly under-voiced, hold or add.
- With an estimate of competitor digital: built from public ad libraries and observed impressions, as a range. Share of voice about 20.7%, somewhere between 18% and 23%. An excess between +1 and +6. Verdict: modestly ahead, possibly fine.
The same brand, the same months, three answers pointing in opposite directions. The fitted relationship between excess voice and share change cannot rescue this, because it is estimated from the same mismeasured column for every brand. Worse, the error is not the same size for each brand. It is enormous for the digital native and small for the TV-heavy leader, so the model would learn that the brand spending least on monitored media gains share for free. That is not a finding about advertising. It is a finding about the monitoring service.
Had we forced the analysis on the file as delivered, the report would have said, with a confidence interval and a clean chart, that the brand could cut £1M. The interval would have been honest about sampling noise and silent about an input that was wrong at the source. No statistical method fixes a column that measures something other than what its header says.
What to do instead
We did not run the share-change model. We recommended four things, in this order.
- Never mix sources across brands. Own spend from finance and competitor spend from monitoring are not the same quantity. If the competitor side is offline only, the own side must be offline only too.
- Estimate competitor digital explicitly, as a range. Ad libraries show creative counts and rough spend bands. Impression panels show reach. Neither is precise, and both are better than zero. Write down the low case and the high case.
- Run the analysis at both ends of the range. If the verdict survives both, you have an answer. Here it did not: at the low end the brand was close to parity, at the high end comfortably ahead. That is useful in itself, because it says a £1M cut is not obviously safe.
- Treat the cut as a test, not a conclusion. Reduce spend in a defined set of regions for eight to twelve weeks and compare with the rest. That measures what the brand loses directly, without needing anyone's share of voice.
The brand cut £300k rather than £1M, in two regions, and kept the rest of the plan until the test read out.
The lesson
A share of voice is only as good as the narrowest source in its denominator. Before reading any excess share of voice, ask which channels each brand's spend was measured in, and by whom. If the answer differs between you and them, the number is not wrong by a little. It can be wrong in sign.
The Competitive Path
- Excess share of voice: where a challenger brand actually gained
- Share of voice when your monitoring service misses digital spend
- Competitor discount week: 2.1% of our volume, not the feared 8% (out October 10, 2026)
- A new entrant after ten weeks: too few to measure cross-elasticity (out October 15, 2026)
- Should we match a competitor's 25% discount? Lift, margin, hold (out October 20, 2026)
- Promotions that always coincide with the rival's cannot be split (out October 25, 2026)
- A lost share point, decomposed: their media, their price, our season (out October 30, 2026)