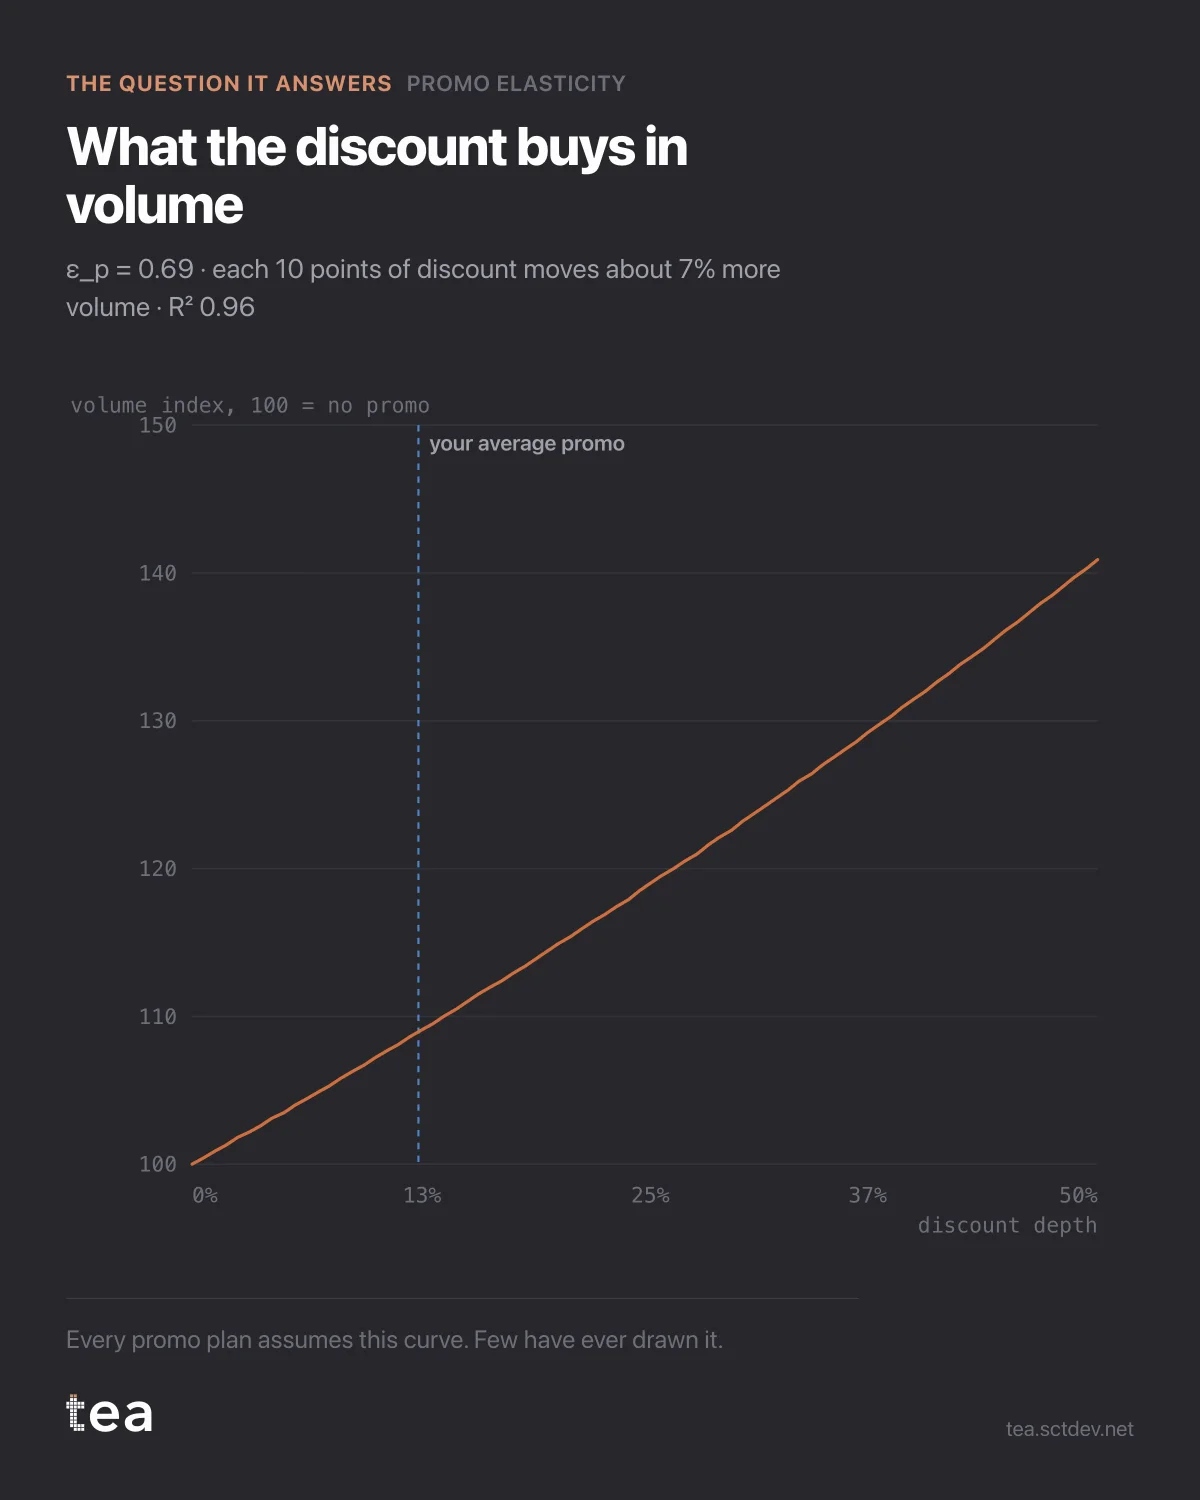
Six years of rate discounts against shipped volume at a logistics operator. The curve is what the discount buys.
The semi-elasticity is 0.69. Each ten points of discount moves about 7% more volume. R² is 0.96, so the relationship is not in doubt: the discount works.
Hold that word for a second, because this is where promotional reporting usually stops. The discount works. Volume went up. The mechanic is validated, the case study gets written, and the same depth runs again next quarter.
Everything in that sentence is true and the decision it leads to is wrong, and tomorrow's chart is the reason why.
For now, the useful part of this one is the shape. It is a curve, not a step. There is no magic depth at which demand suddenly wakes up, and there is no ceiling inside the observed range either. Volume responds smoothly, which means every extra point of discount buys a little more volume than the point before bought, in percentage terms, and that is exactly the property that makes deep discounting feel like it is working.
The marker is where this business actually runs: an average depth of 12.5%, which delivers about 9% more volume.
Two things the model had to control for to get here.
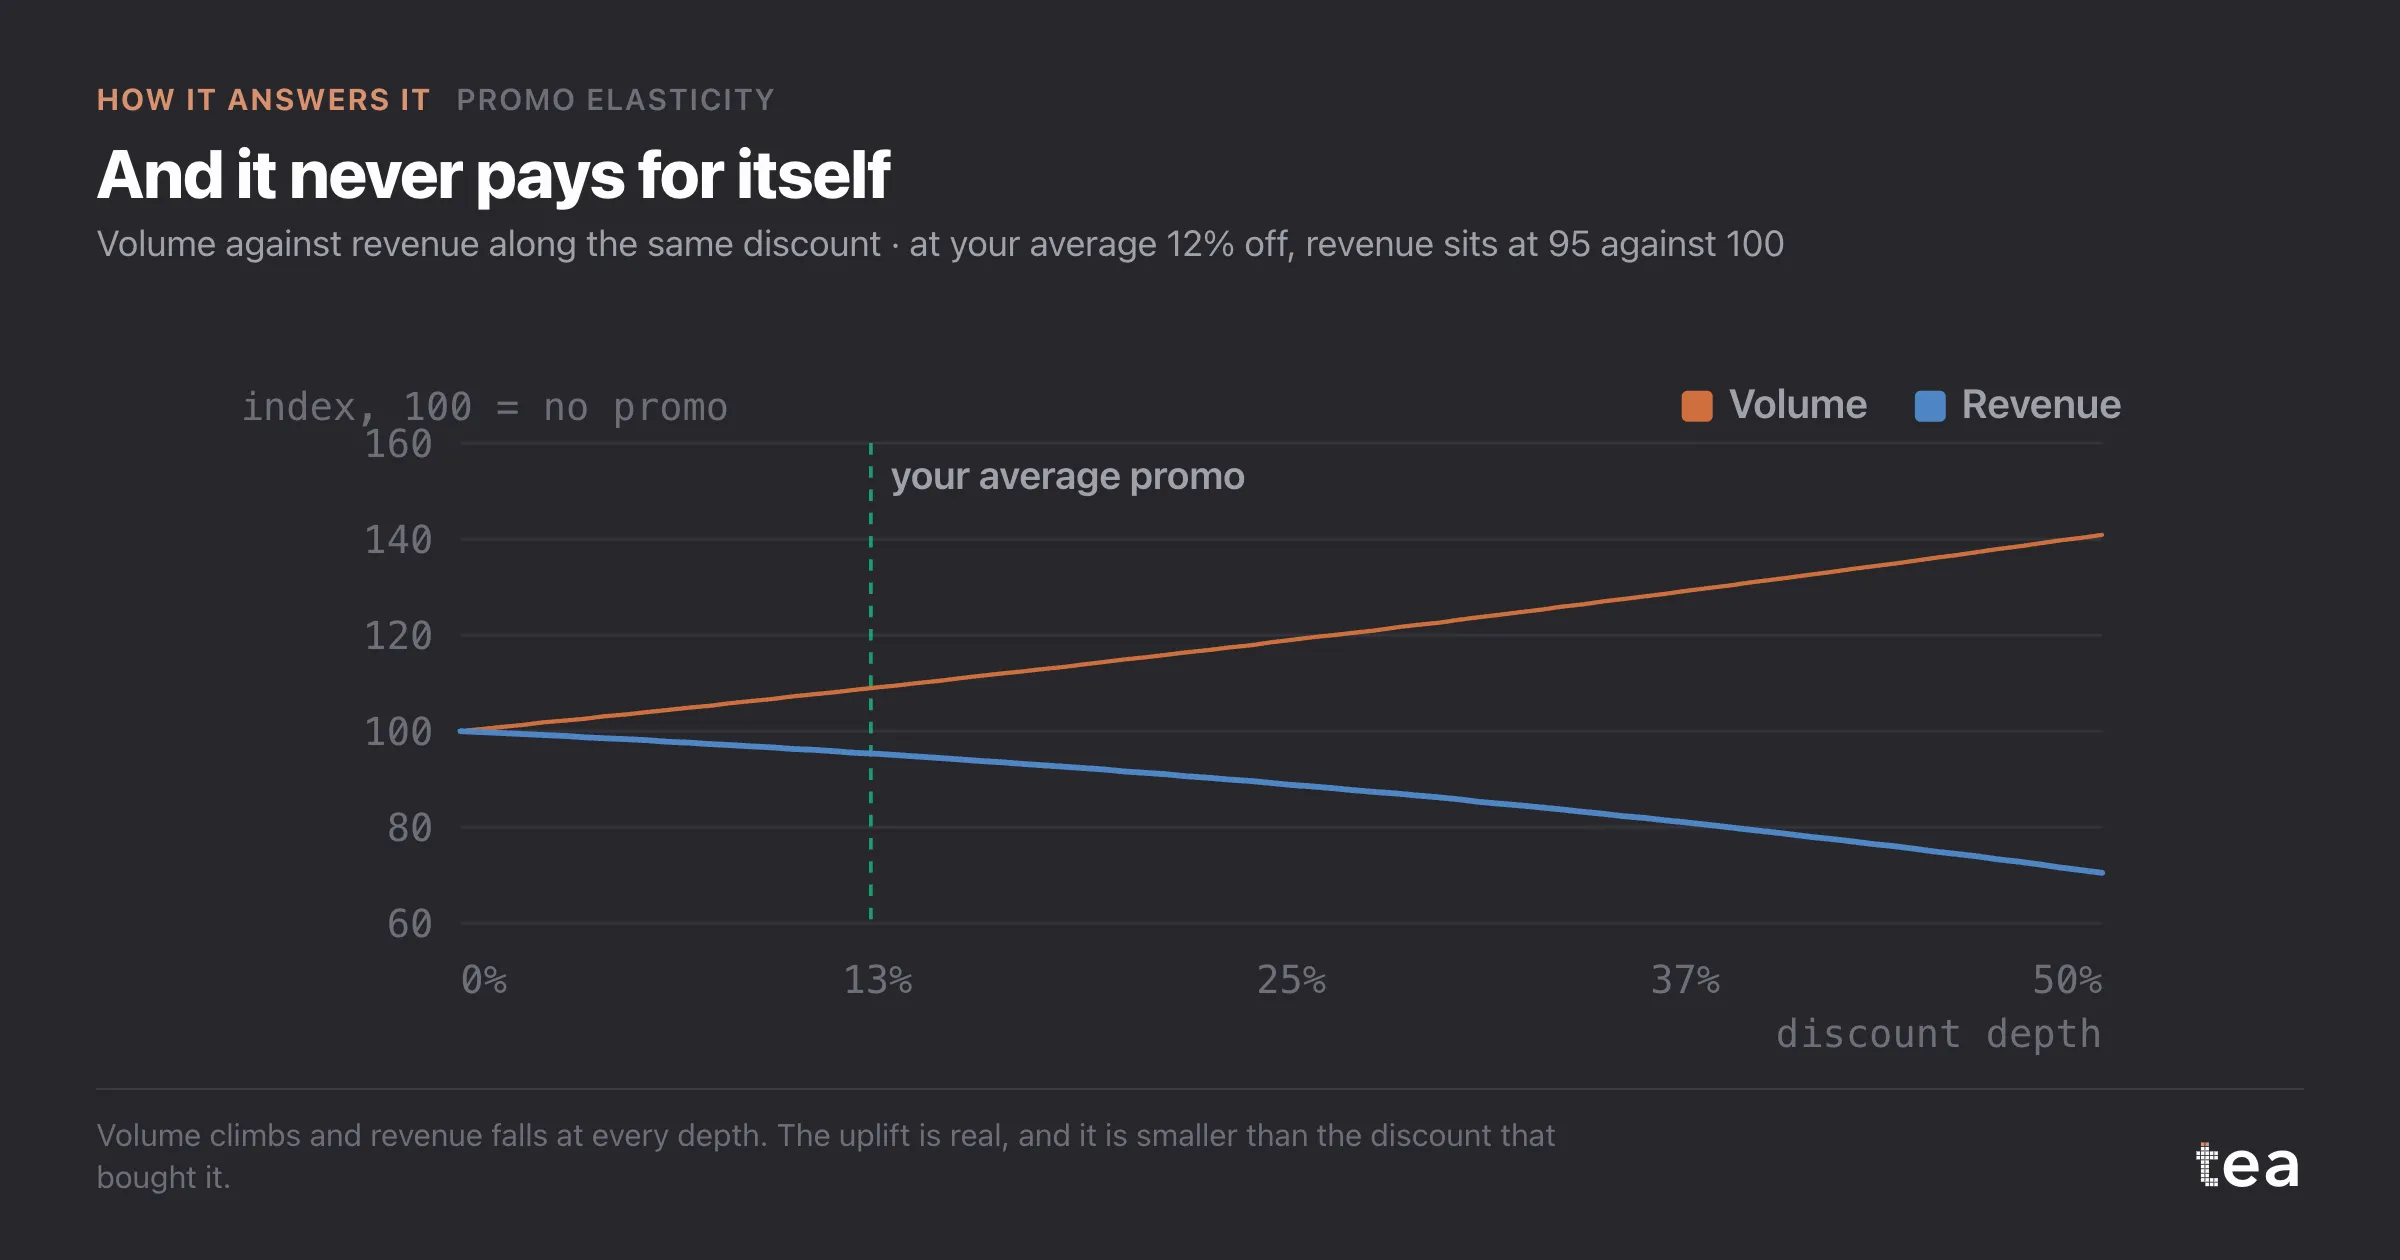
Price itself, separately from the promotion. A discount is a price change, and a promotion is also a mechanic with visibility attached. Fitting both lets the model separate the depth from the fact that something ran at all.
And the service type, because Express, Freight and Standard do not respond the same way. The pooled curve is an average of three businesses, and the segment estimates behind it range from 0.26 to 1.26.
A curve like this is the minimum evidence for a promotional calendar. Most calendars are built on last year's calendar.
Worth naming what this analysis is not. It is not an incrementality test: nobody withheld the promotion from a matched group. It is a model of six years of observed depth and volume, with price and service type controlled, and its honesty lives in the interval rather than in a holdout.
The reason to run it anyway is that promotional calendars are usually built with no evidence at all, and the gap between no evidence and an estimate with an interval is much larger than the gap between an estimate and a test.
One practical tip: keep the depth column as an actual percentage, not a flag. A binary promoted or not column can only tell you that something happened. The depth is what lets you draw a curve, and the curve is where the decisions are.
The chart is the actual output of Promo Elasticity in TEA, run on a sample file anyone can download.