ea

Analyses/Pricing & Promo Path/Promo Elasticity

What a discount really buys, after the dip.

Promo Elasticity measures how much extra volume each point of discount depth buys, and what revenue is left once the discount is paid for. A promotion is the weeks it ran and the weeks after, and its lift is only honest when both are counted.

Answers What does each point of discount buy in volume? Needs Weekly volume, discount depth, normal weeks Hands back Lift per point, uplift and revenue curves

The two weeks everyone saw, and the four after

a typical 30%-off wave, units a week
  • Units sold
  • No-promo baseline
Gross lift+80%in the promoted weeks, +72% to +88%
Pulled forward34%of the lift, gone in the four weeks after
Margin per wave−€24ksix weeks, with the dip counted

A biscuit brand’s 30%-off wave in Spanish grocery, from the first example below. A composite case: your file draws its own curve, with its interval.

01

What it is for

A discount buys volume in the weeks it runs. Part of that volume would have come anyway, at full price, a few weeks later. The lift worth paying for is what is left when both are counted, and the discount is what it costs.

Choosing a depth

Each point of discount buys a measured amount of volume. The uplift curve shows how much at every depth, and the revenue curve beside it shows the depth beyond which the discount gives away more than the volume brings back.

Deciding how many waves

A wave that loses margin is not saved by running it more often. Netted of the weeks after, the lift says whether the calendar is an investment or the cost of the feature space, and how many slots it deserves.

Choosing the mechanic

Tag each promotion with its type and the result compares the mechanics side by side, with how often each one ran. The most used one is not always the one that earns its depth.

02

How to read it

The top of every result: a badge, four numbers and two curves, here on tea’s freight sample file, 312 weekly observations across three service types. Read them in this order.

Promo lift analysis Low lift1
Semi-elasticity +0.6862 p-value 0.0433 R² 96.1%4 Avg uplift index 108.95

Volume uplift curve

Revenue efficiency

  1. The badge. High lift, moderate lift, low lift, or dilutive, read off the semi-elasticity: under 1 is low, 1 to 2.5 moderate, above that high. Under 1 is also where the discount costs revenue from its first point. Dilutive means volume fell with deeper discounts, and the page asks you to check the calendar before believing it.
  2. The semi-elasticity. The change in volume per unit of depth, on a 0 to 1 scale. Read it as: each ten points of discount buy about ten times that in per cent, here about 6.9% more volume. The interval sits under it, 0.022 to 1.350 here: it crosses 1, so the data does not rule out a depth that pays.
  3. The p-value. Whether a lift this size could come from no relationship at all. 0.043 is just under 0.05: the discount moves volume, and how much is not pinned down.
  4. The fit, R². How much of the weekly movement in volume the model explains, with the observations under it. 96% is high because price is in the model too. It does not say the lift is net of anything.
  5. The average uplift index. The volume the model projects at the average depth of the promoted weeks, 12.5% here, against 100 with no promotion. It is a gross figure: it counts the weeks a promotion ran, not the weeks after it.

03

Where it sits in the analysis

Promo Elasticity is the second step of the Pricing & Promo Path, after Price Elasticity, because a discount is a price change with a display attached. Add the price column and it goes into the same model, so the discount is not credited with what the price did.

What you carry forward is the lift per point of depth and, once the weeks after each wave have been measured, the share of it that was borrowed from them. Cross-Elasticity then asks whether the volume you won came from a competitor or was given away.

Base vs Incremental takes the same question at the level of the whole year: how much of the promotion period was incremental, and how much would have sold anyway.

Also a step of the Competitive Path.

Pricing & Promo Path

  1. Price Elasticity

    How demand answers a price move, with the confidence band and the revenue curve.

  2. Promo Elasticity this page

    The incremental lift of the promotions, net of the demand that was coming anyway.

    Carries forward: promo lift per point of discount, by mechanic

  3. Cross-Elasticity

    Whether the competitor move takes your volume or leaves it alone.

  4. Scenario Simulation

    The price and promo calendar you are considering, run against all three elasticities at once.

04

Where it usually misleads

A promotion always looks like a success in the weeks it runs. The problems are in what the comparison leaves out: the weeks after, the weeks that were never normal, and the cost of the discount itself.

Pull-forward counted as lift

Shoppers who would have bought in three weeks buy two packs at 30% off, then do not come back for a while. Anything that keeps in a cupboard does this. On the biscuit file the four weeks after each wave gave back 34% of the lift. First example below.

Promo Elasticity reads promoted weeks against the rest and does not net the dip out on its own. Add the four weeks after each wave as an event of their own in Seasonality & Event Impact, and take that dip off the lift before you price the wave.

No normal week to compare

The lift is the gap between promoted and unpromoted weeks. When a site is on promotion 48 weeks a year and the other four are all late January, the gap is mostly the difference between January and the rest of the year. Second example below.

Scouting a file counts promoted and unpromoted periods and stops the analysis with fewer than five of either. A depth that never changes stops the run itself.

Depth that moves with the season

The deepest discounts run at Black Friday and before Christmas, the strongest weeks of the year, and the media that announces them goes up too. Depth, season and spend rise together, and the model credits the peak to the discount.

Promo Elasticity has no season term of its own. Vary the depth on purpose outside the peaks, alternating two depths in fortnightly blocks, so depth stops moving with the calendar.

Uplift read without the discount

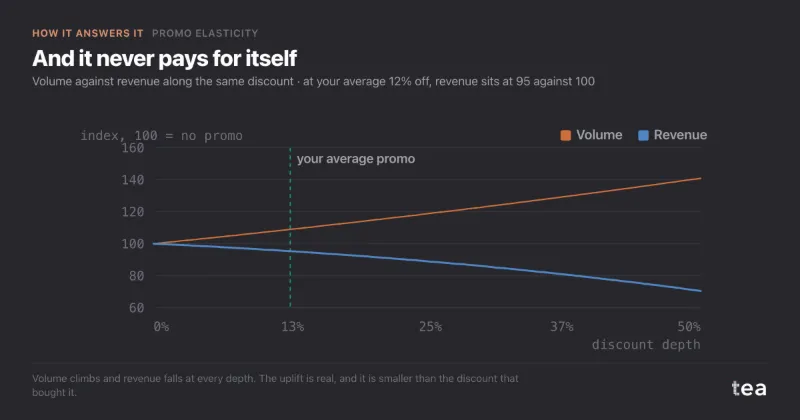
Nine per cent more volume at 12.5% off is a lift every report would call a success. Revenue at the same point is about 95 against 100. The uplift is real and the mechanic loses money, and an uplift table can never show both.

The revenue efficiency curve sits beside the uplift on every result: revenue after the discount, against a break-even at 100. Margin is one step further, and yours to apply.

Your promotion and theirs in the same weeks

Retailers sell event weeks as a package, and both brands buy in. When 17 of your 18 promoted weeks are also the rival’s, the model cannot tell your lift from their pressure, and either number alone means nothing.

Put the two calendars side by side before the run. If they always overlap, measure the joint week, and create a week apart on purpose: skip one event at one chain.

A mechanic judged on eight runs

The mechanic comparison is a plain average of promoted weeks against unpromoted ones, with nothing held constant. A gap between 18.5% over eight runs and 15.1% over nine is not something to reorganise a calendar around.

Types with fewer than five promoted weeks are left out of the comparison, and each bar’s run count is in its tooltip. Move money only between the mechanics that have run often.

05

Two examples

One file where the analysis changed a decision, one where it could not answer. Both are useful results.

Helps

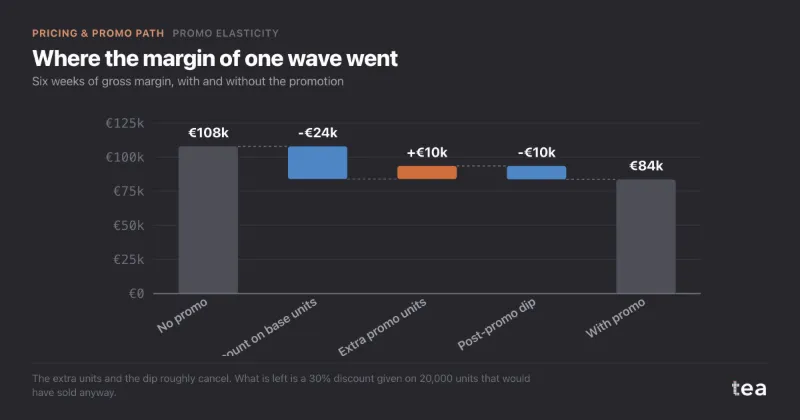
The +80% wave that lost €24k

A biscuit brand sold about 10,000 packs a week in Spanish grocery at €4.00, with €1.80 of gross margin a pack. Six times a year it ran two weeks at 30% off, and every time the promoted weeks came in about 80% above normal. The retailer offered a seventh slot.

Eighteen waves, six to ten weeks apart, left the weeks after each one visible. They sold 24%, 16%, 10% and 5% below baseline: 5,500 packs, 34% of the lift borrowed from the following month. Priced, a typical wave ended about €24k down on margin. The seventh wave was declined, the six became three at 20% off, and the cost of the calendar fell from about €146k a year to about €38k.

Read the full case

Where the margin of one wave went

six weeks of gross margin, €k

The extra packs and the dip almost cancel. What is left is 30% off on 20,000 packs that would have sold anyway.
Does not help

Forty-eight weeks a year on promotion

An online homeware retailer in Spain, about €14M a year, had carried a sitewide discount for so long that nobody remembered starting it. The new commercial director asked what it bought. In the last year 48 of 52 weeks were discounted, and the four at full price were all late January.

Against four January weeks, any lift is mostly the difference between January and the rest of the year, and the deepest discounts ran with Black Friday and the media that announced it. Forced, the fit gave +118%, with an interval from +20% to +260%. The useful move was to stop asking the promotion question: read the price actually charged with Price Elasticity, and create full-price weeks outside January on purpose.

How the 52 weeks split by discount depth

weeks at each sitewide discount, last twelve months

The no-promotion bar is four weeks of January. Any lift measured against it is mostly the difference between January and the rest of the year.

06

What the charts add to the numbers

A semi-elasticity is one number, and a trade committee reads it three ways: how volume answers depth, what revenue is left, and which mechanic earns its depth.

Volume uplift curve

volume index, 100 = no promotion

Reads as: how volume answers depth. It is a curve, not a step: there is no depth where demand suddenly wakes up, and no ceiling inside the range. The dashed line is the depth the business actually runs, 12.5% on this sample, worth about 9% more volume.

Revenue efficiency

volume and revenue after the discount, 100 = no promotion
  • Volume index
  • Revenue efficiency index

Reads as: whether the volume pays for the discount. Revenue is (1 − depth) × volume, so where the dashed line sits under 100 the discount gives away more than the volume brings back. Below a semi-elasticity of 1 it never recovers, at any depth. Show both lines, or the volume one renews the promotion forever.

Promo type effects

average uplift against unpromoted weeks, by mechanic

Reads as: which mechanic earns its depth. On this sample the most used, volume rebate with 29 runs, returns the least, while contract discount gives away less and returns more than twice as much. Each bar is a plain average with nothing held constant, so count the runs before moving money between them.

tea, the product

Measure what your own discounts buy

A CSV with a date, volume and the discount depth. The lift, its interval, the revenue curve and the depth scenarios, in minutes, and a plain sentence when the depth never changed. Free while in beta, by invitation.

Request a place in the beta

tea, the product

Fifteen econometric analyses on your own CSV: Promo Elasticity, saturation curves, elasticities, budget allocation. The diagnostics shown, and a plain sentence when the file cannot answer.

Free while in beta, by invitation.

Request a place in the beta →

Now run it on your own data.

tea runs Promo Elasticity and fourteen other analyses on any weekly CSV, in minutes. Free while in beta, by invitation.

Join the beta