German challenger oat drink brand, about €31M a year, asking whether its excess share of voice paid and where.
A composite case, built from the kind of file we see most weeks: a challenger oat drink brand in Germany, about €31M of annual retail sales in a plant-based dairy category worth roughly €280M. Six brands, one of them twice the size of anyone else.
The question
The marketing director put it plainly: "We spend above our share and we are growing. Is the spend the reason, and if it is, where did it work?"
The board already believed the first half. The brand's share of voice had sat above its share of market for two and a half years, the textbook position for a challenger, and share had gone up. The second half was the real question, because next year's budget was flat and someone had to decide how to phase it.
What the file looked like
Thirty months of data, January 2024 to June 2026, one row per brand per month: 180 rows in total. Media spend for all six brands from a monitoring export, sales value from retail panel data.
Across the window the brand averaged 18.4% of category voice against an average value share of 10.5%, an excess share of voice (ESOV) of about 8 points. Share had moved from 9.6% to 11.2%, a gain of 1.6 points.
What the file did not have was any experiment. It also gave no reason to think the monitoring missed much: the brand and its competitors were mostly on TV and online video, both covered by the service. That matters, and the next case in this thread is about what happens when it does not hold.
What the analysis did
Competitive Pressure does two things with a file like this.
First, it fits the relationship between excess share of voice and share change across all brands and months, instead of assuming the industry rule of thumb. Here the slope came out at 0.07 share points a year for each point of ESOV, with a 95% interval from 0.03 to 0.11. Positive, not large, and clearly not zero. On average, the extra voice was buying share.
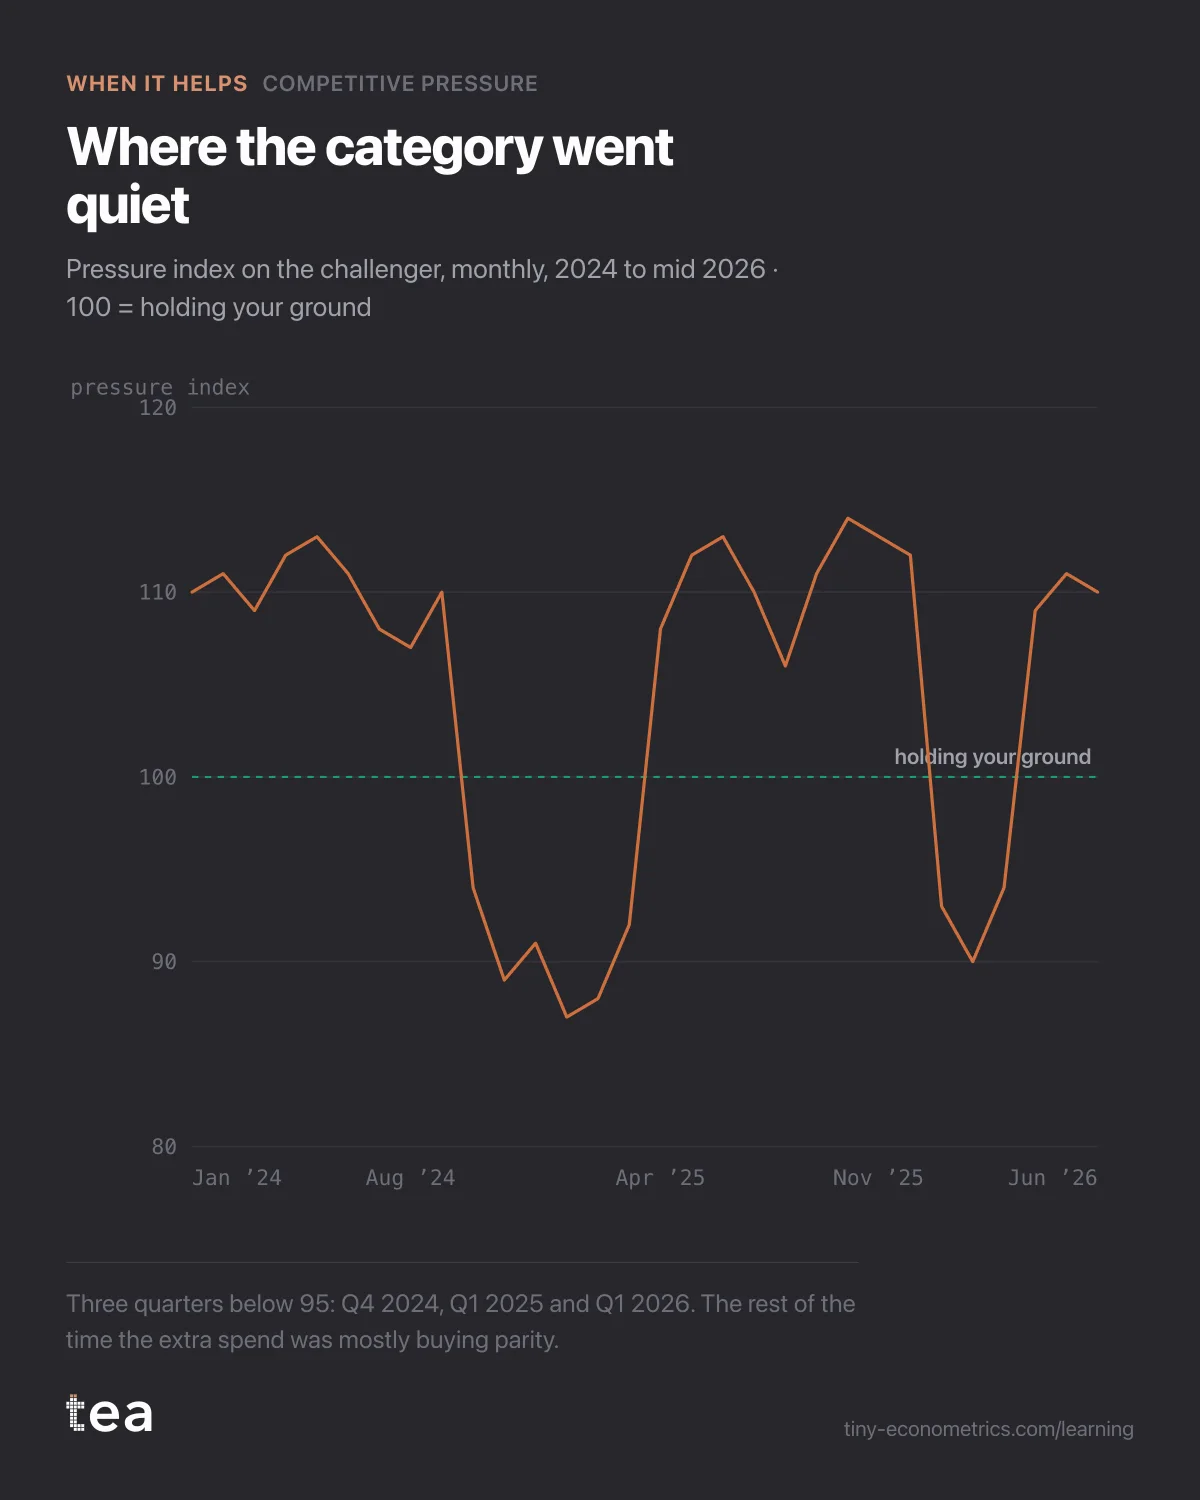
Second, it builds a pressure index by period: what everyone else spends relative to what you spend, scaled so that 100 is the level at which you hold your ground. Above 100 the category is out-shouting you relative to your size. Below 100 you have the room.
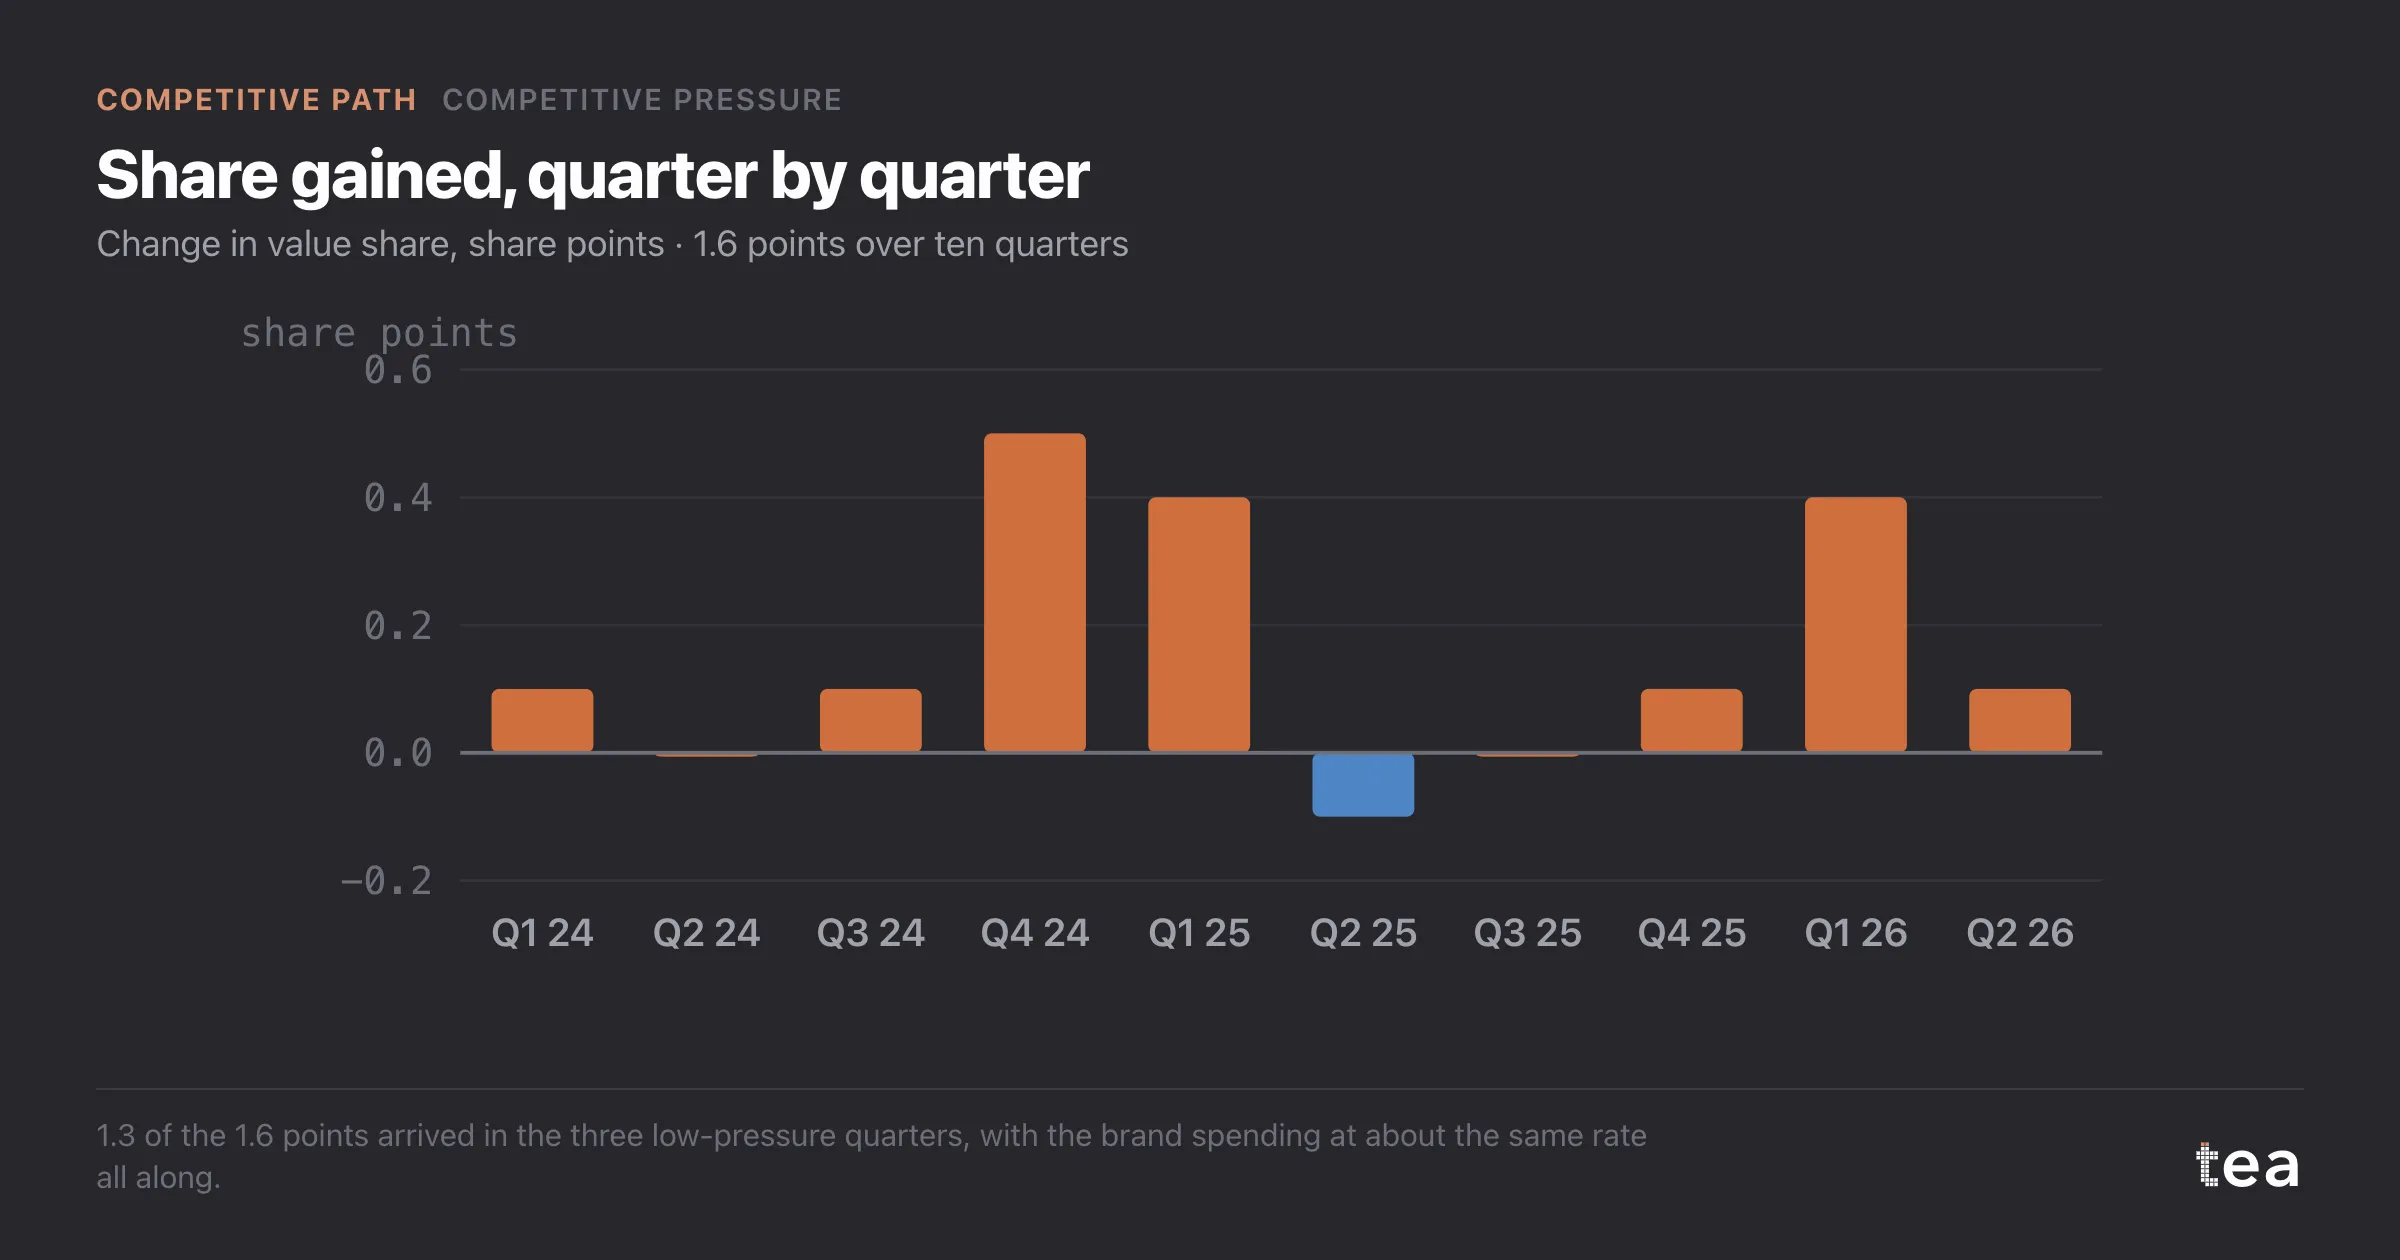
This is where the average fell apart. The index sat between 106 and 114 for most of the window. The leader and the number three ran heavy, continuous schedules, and the challenger's spend, large for its size, did little more than keep pace. But in three quarters the index dropped below 95: Q4 2024 and Q1 2025, when the leader cut its media during a reformulation, and Q1 2026, when two competitors went quiet after Christmas.
Those three quarters produced 1.3 of the 1.6 points gained. The other seven quarters, with the brand spending at roughly the same rate, produced 0.3 between them.
The verdict: the voice works when it is heard
The analysis helped, and the decision it changed was the phasing, not the total.
The old plan spread the flat budget evenly across twelve months, which is what an always-on philosophy produces. The model said that most of each euro spent in a high-pressure month was buying parity, and parity was not where the share came from. The new plan kept the same annual total and moved about 35% of it into the windows where competitor pressure has historically dipped: January to March, and the weeks after a competitor's known launch burst ends.
Assuming no competitor goes quiet of its own accord, the even plan projected a gain of about 0.2 share points over the next year. The re-phased plan projected 0.4, with an interval from 0.1 to 0.7. In a category of €280M, a fifth of a share point is around €560,000 of annual retail sales, from the same money.
Two cautions came with it, and we put them in the report rather than in a footnote.
The pattern rests on three low-pressure quarters. That is enough to see a difference of this size, not enough to be precise about it, which is why the interval is wide. And competitors read the same calendar. If the leader learns to defend January, the window closes, so the index has to be refreshed every quarter rather than trusted once.
There is also a question monthly data cannot fully answer: how long a burst keeps working after it stops. If the next step is to plan bursts rather than months, weekly data and an adstock estimate from Lag & Carryover would sharpen the timing. That is a separate analysis, and an honest one to add.
The lesson
An excess share of voice is an average, and averages hide where the growth actually happened. Before deciding how much to spend against the category, look at when the category was loud and when it was quiet. A challenger rarely wins by out-shouting the leader. It wins in the weeks the leader is not talking. The rest of the Competitive Path builds on this: once you know when their pressure costs you, the next question is what their price does.
The Competitive Path
- Excess share of voice: where a challenger brand actually gained
- Share of voice when your monitoring service misses digital spend
- Competitor discount week: 2.1% of our volume, not the feared 8% (out October 10, 2026)
- A new entrant after ten weeks: too few to measure cross-elasticity (out October 15, 2026)
- Should we match a competitor's 25% discount? Lift, margin, hold (out October 20, 2026)
- Promotions that always coincide with the rival's cannot be split (out October 25, 2026)
- A lost share point, decomposed: their media, their price, our season (out October 30, 2026)