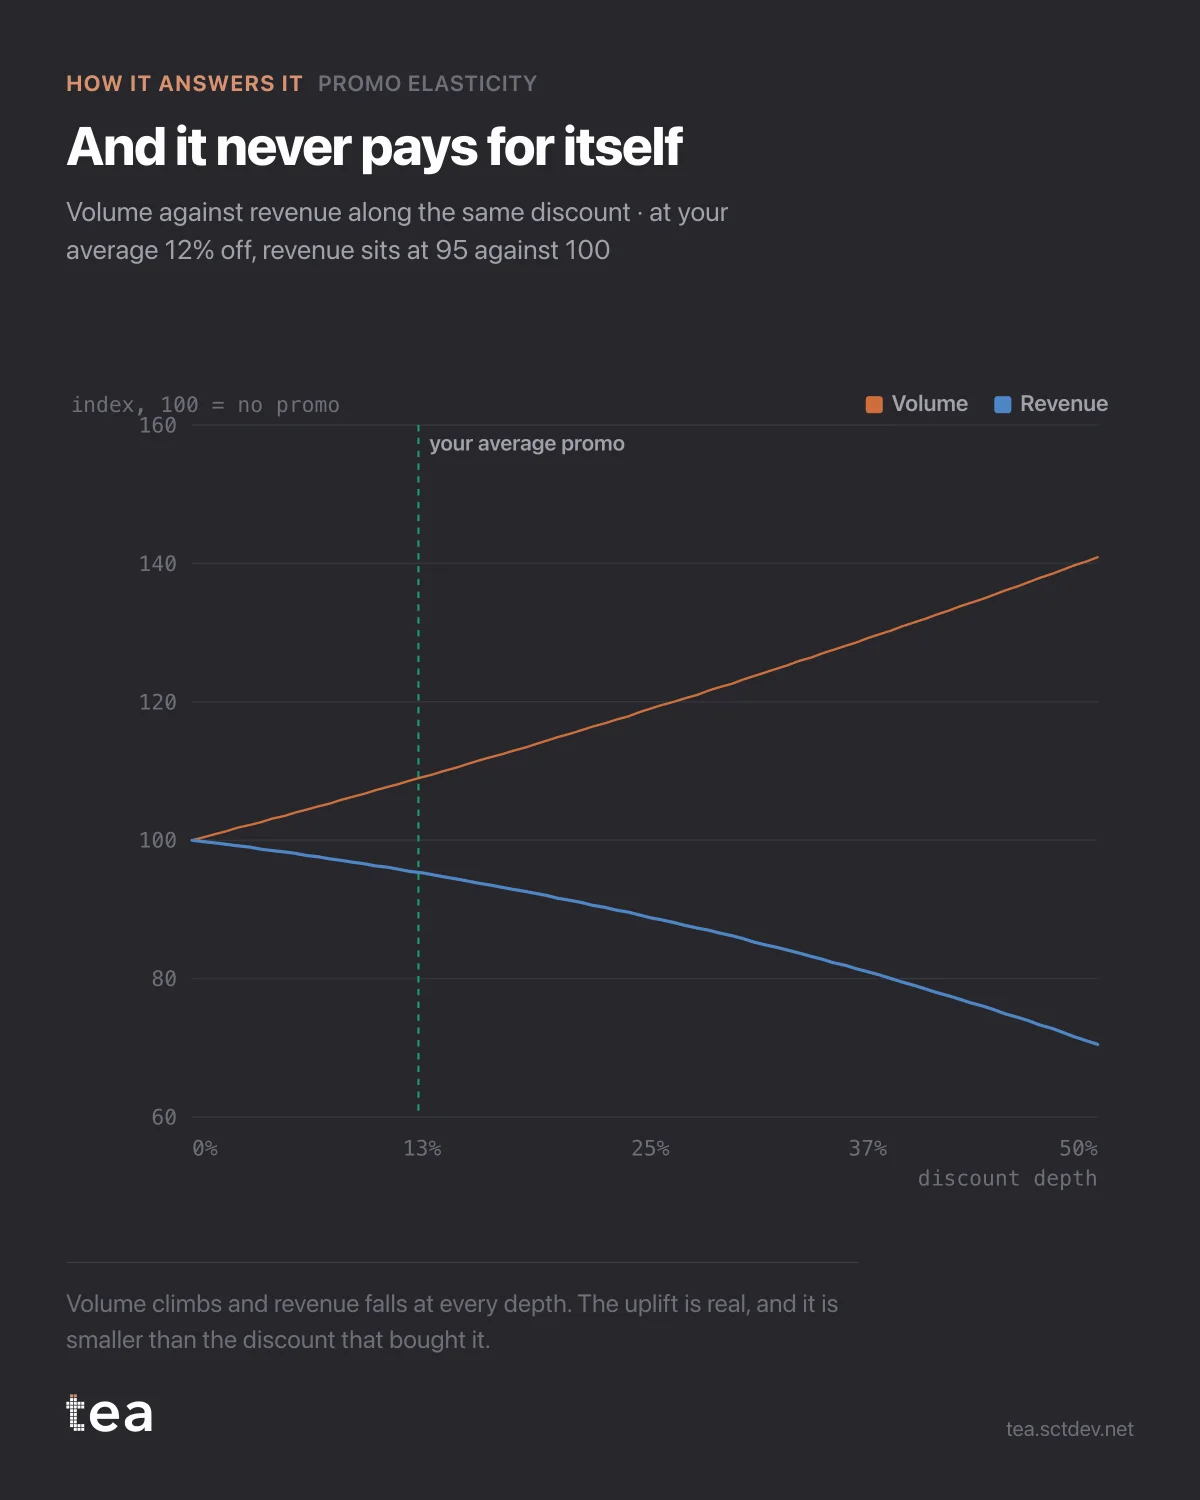
Two lines, one discount. The orange one is volume. The blue one is revenue. They go in opposite directions, and that gap is the entire argument about promotions.
The uplift is real. At the average depth this business runs, 12.5% off, volume is 9.1% higher than with no promotion. Every promotional report ever written would call that a success.
Revenue at the same point is 95.3 against a base of 100.
There is no depth at which it recovers. The revenue line falls from the first point to the last, because the semi-elasticity is 0.69 and the arithmetic is unforgiving: you give up 12.5% of price to gain 9.1% of volume, and the product of the two is less than you started with.
This is the case a promotional uplift table can never show, because an uplift table only has the orange line in it.
The general rule is easy to state. Discounting pays when the semi-elasticity is above 1, which is when the volume gained exceeds the price given away at that depth. Below 1, every point of discount costs more than it brings, and the deeper the promotion the worse it gets.
Where this gets interesting is that the measured uplift is completely genuine. Nobody is faking anything. The promotion moves volume, the volume is incremental, the report is accurate, and the business is losing money on the mechanic. Accuracy and usefulness are not the same property.
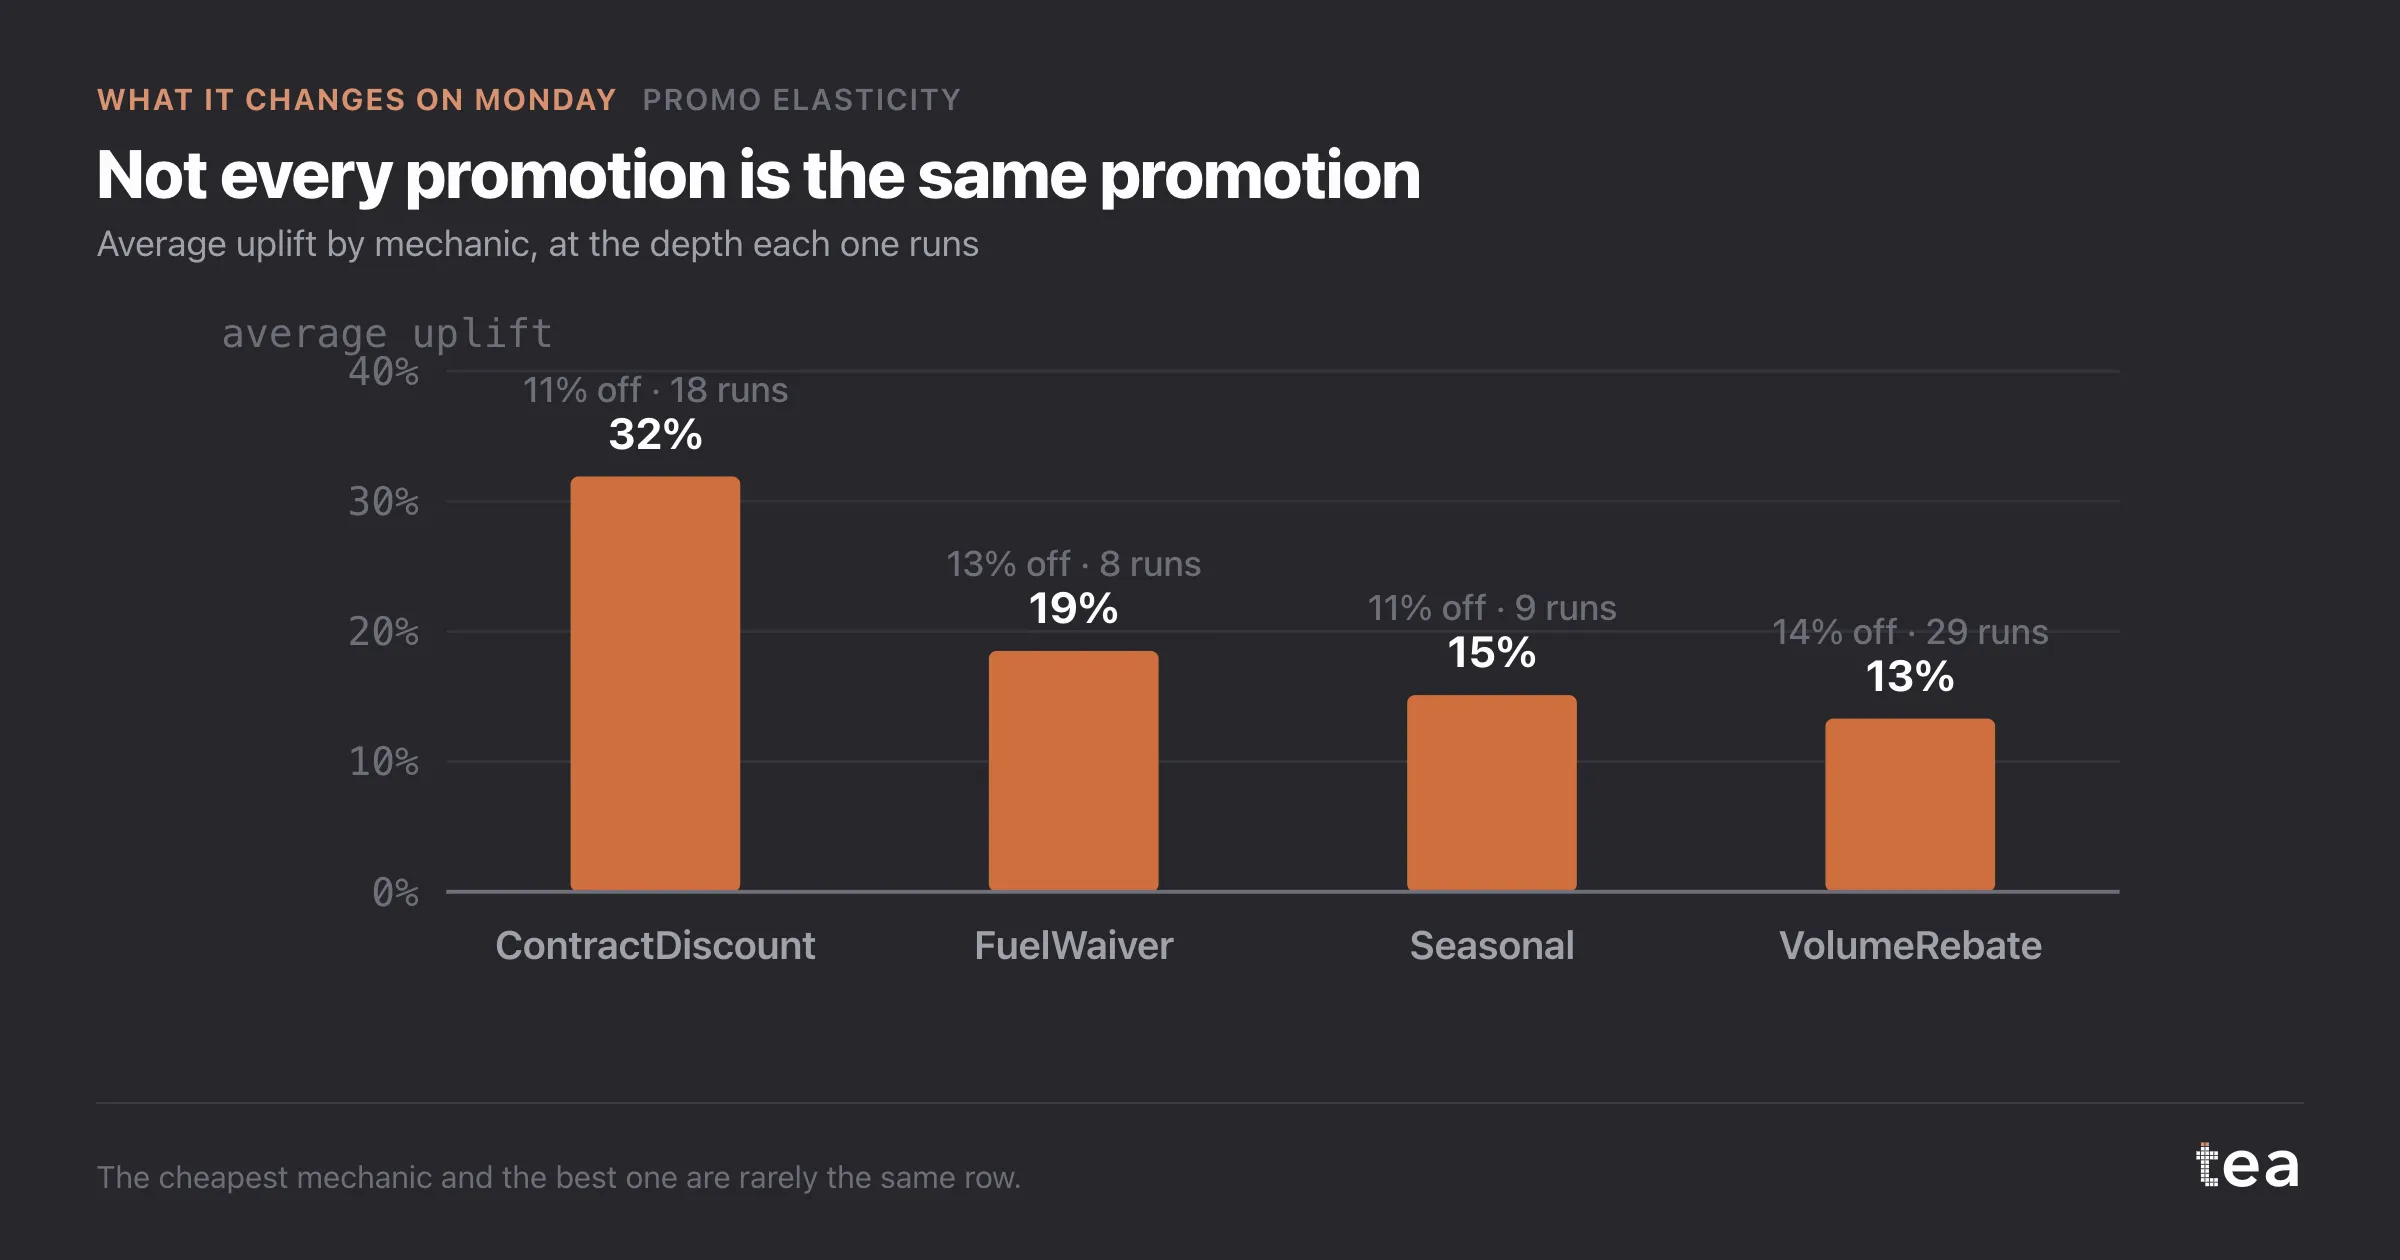
Two things to check before acting on a chart like this.
The interval. The semi-elasticity here is 0.69 with a 95% range from 0.02 to 1.35, which crosses 1. So the direction is clear on the point estimate and the case for running fewer promotions is strong, but the data does not rule out a depth that pays. That is worth saying out loud rather than rounding away.
And the segments. Standard service comes back at 1.26 while Express is at 0.42. A single promotional policy across three services is subsidising one of them with the other two.
If you present one of these two lines to a commercial team, present both. The volume line alone is how a promotion gets renewed forever. The revenue line alone sounds like the analyst is against promotions on principle.
Together they set up the only question worth arguing about, which is what the promotion was for. Volume at a loss is a legitimate strategy when it buys distribution, defends a contract or clears stock. It is not a legitimate strategy when nobody realised that is what it was doing.
The chart is the actual output of Promo Elasticity in TEA.
tea, the product
Your file, this question
Fifteen analyses on a CSV of weekly data, with the intervals and the diagnostics shown, and a plain sentence when the data cannot answer. Free while in beta, by invitation.
Request a place in the beta→tea, the product
Fifteen econometric analyses on your own CSV: Promo Elasticity, saturation curves, elasticities, budget allocation. Intervals and diagnostics shown, and a plain sentence when the file cannot answer.
Free while in beta, by invitation.
Request a place in the beta →Liked this? Run it on your own data.
tea runs Promo Elasticity and fourteen other analyses on any weekly CSV, in minutes. Free while in beta, by invitation.