Italian packaged-coffee brand, €1.8M a year of regional radio and online video, asking whether to keep splitting it by population.
A composite case, built from the kind of file we see most weeks. An Italian packaged-coffee brand sold through grocery, with national TV as the main channel and €1.8M a year of regional media on top: local radio and online video bought region by region.
The regional money had always been split by population. The North-West got 27%, the South 23%, the Islands 11%, and so on. A national model had put the return on that regional spend at €1.9 of revenue per euro, which was fine, and the planning question was whether to do the same again. It came to us like this: "Regional media works on average. Is there any reason not to split it the same way next year?"
What the data looked like
One row per region per week. Four regions, North-West, North-East, Centre and South, with 104 weeks each. A fifth, the Islands, with only 38 weeks, because distribution in Sicily and Sardinia had started late. 454 rows in all.
Each row carried revenue, regional media spend, the TV GRPs actually delivered in that region, shelf price, promotion depth and weighted distribution. Regional spend had varied within each region over time, with flights and pauses, so each region had something to learn from.
What the analysis did
Geo / Segment MMM fits the same model in every region, but not as five separate models. It uses partial pooling. Each region gets its own estimate, and each estimate is pulled towards the national one by an amount that depends on how much the region's own data can say. A region with two years of varied spend mostly speaks for itself. A region with a few months is mostly told what the country thinks, and is allowed to differ only as far as its data insists.
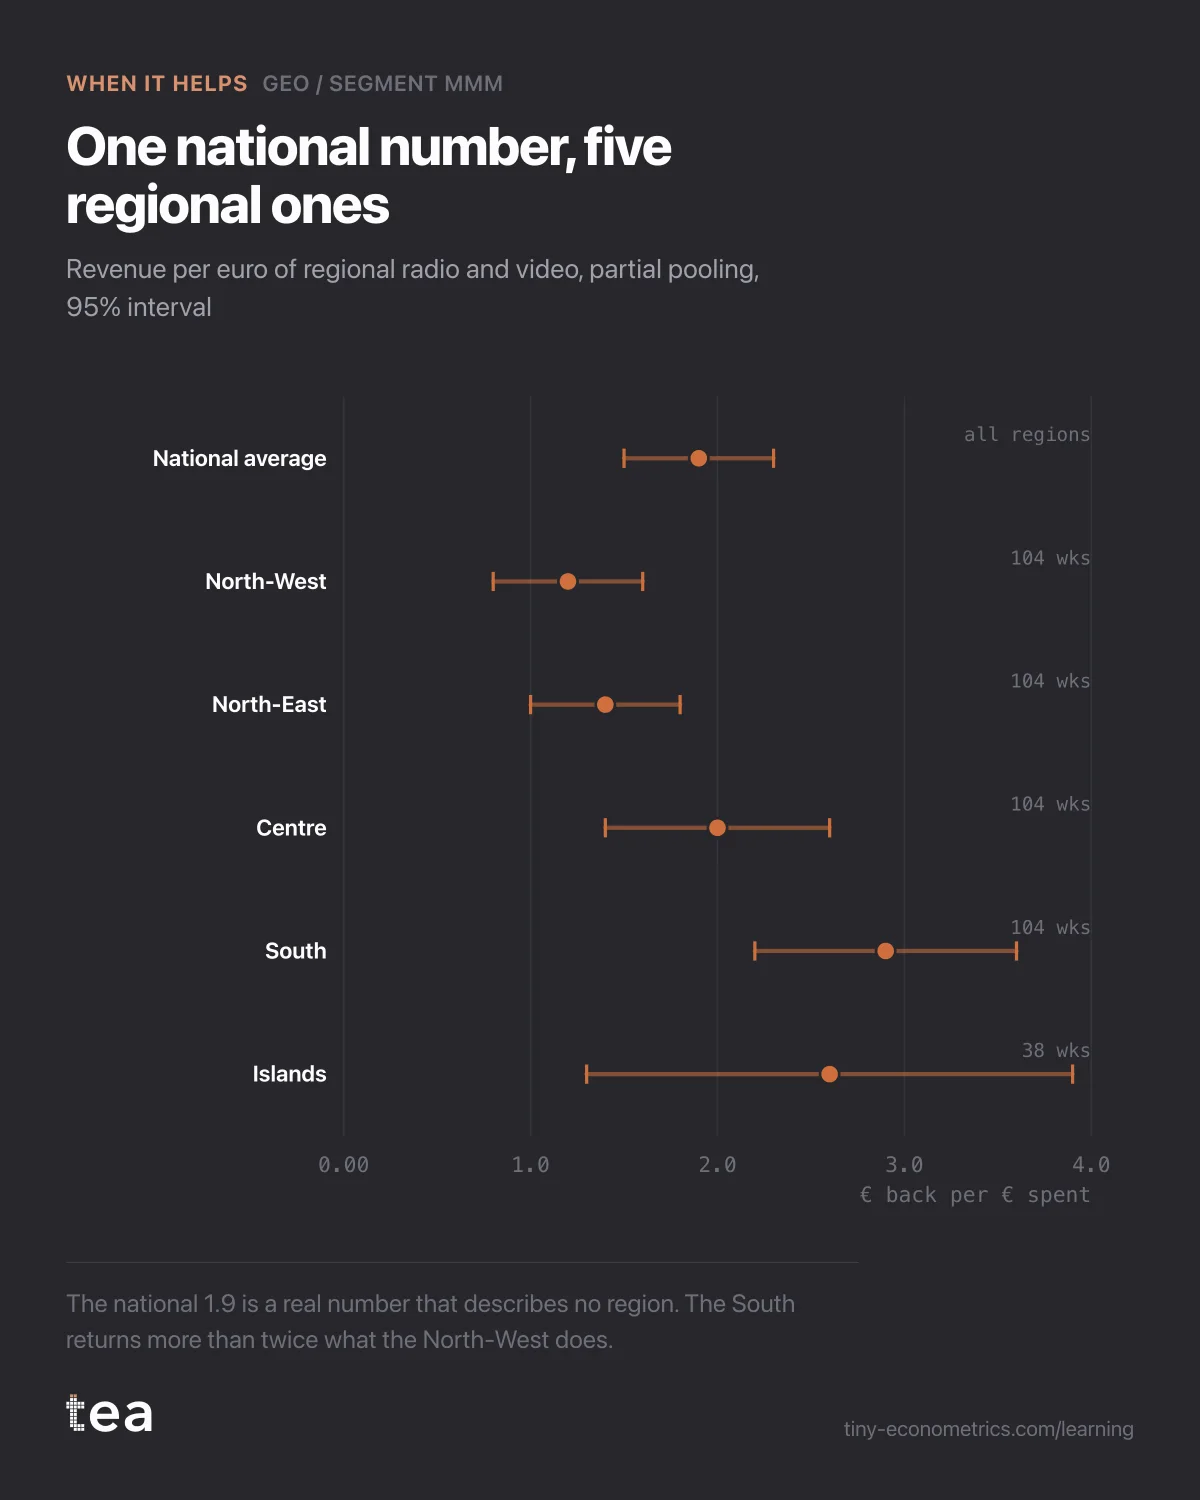
The model also estimates how much the regions genuinely differ, a spread usually called tau. If tau comes out near zero, the regions are effectively the same market and the national number is the right one everywhere. Here tau came out at 0.7 euros per euro, against a national return of 1.9. That is a real difference, not decoration.
The pooled results, revenue per euro of regional media with 95% intervals:
- North-West: 1.2 (0.8 to 1.6);
- North-East: 1.4 (1.0 to 1.8);
- Centre: 2.0 (1.4 to 2.6);
- South: 2.9 (2.2 to 3.6);
- Islands: 2.6 (1.3 to 3.9).
The national 1.9 was a real number that described no region in particular. The South returned more than twice what the North-West did. The file cannot say why, and I would be careful with stories. Higher radio listening, a brand still building in the South and long familiar in the North: all plausible, none of them in the data.
When a region is too thin to stand alone
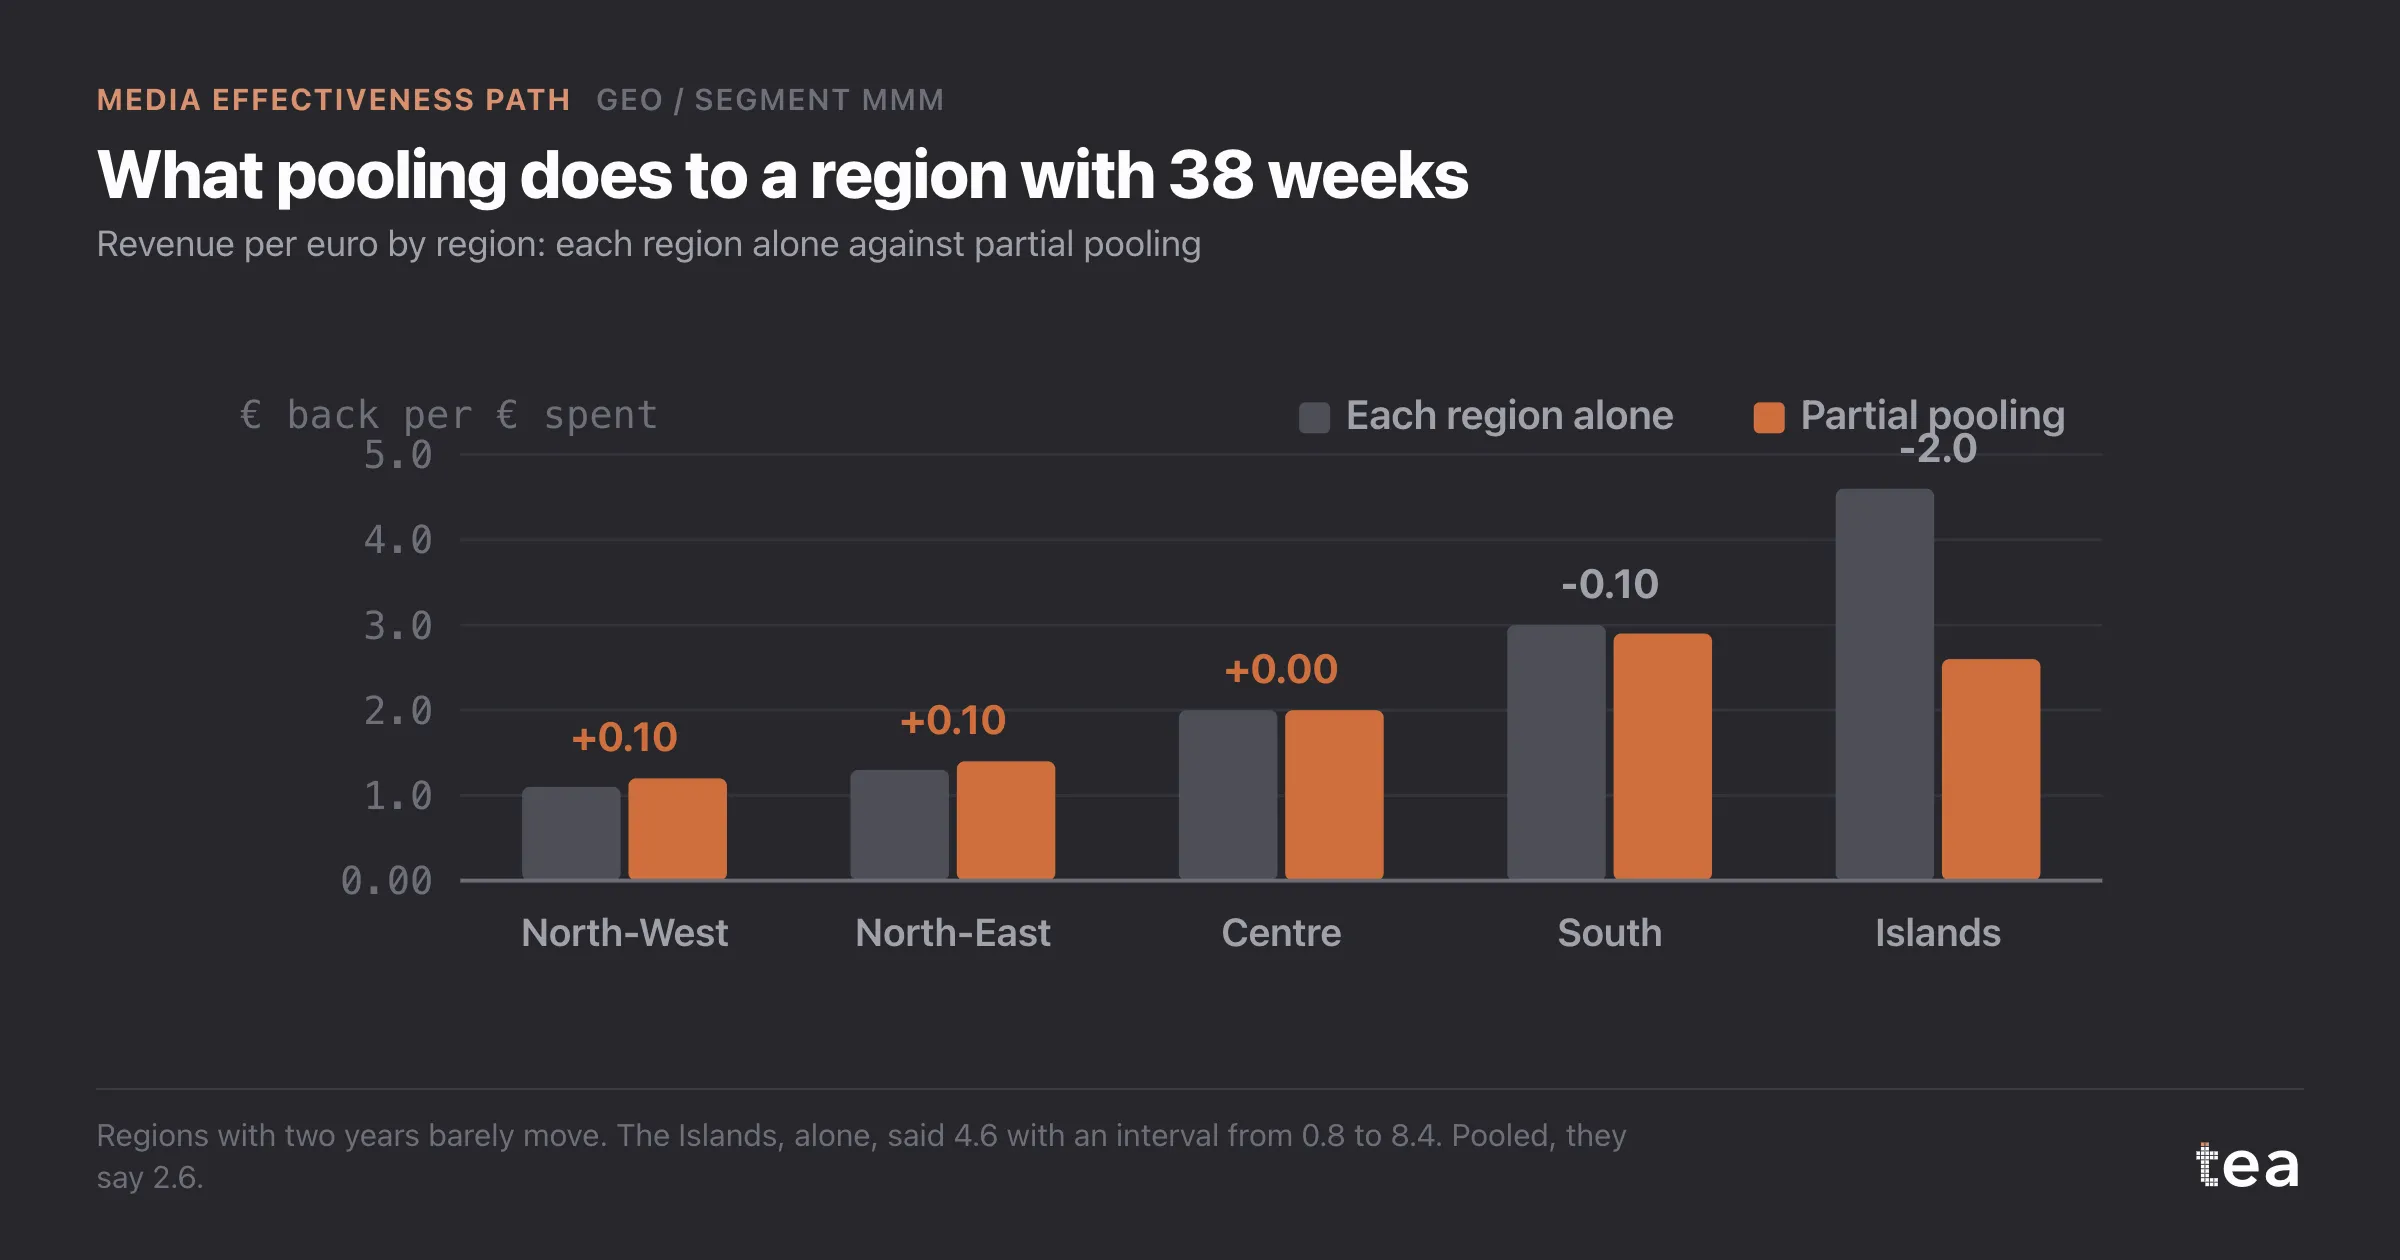
The Islands are the instructive row. Fitted alone, on 38 weeks, they came out at 4.6 per euro, with an interval from 0.8 to 8.4. Taken at face value, that would have made them the best place in Italy to spend, and the next plan would have doubled them.
Partial pooling moved them to 2.6, with an interval about a third as wide. Not because the Islands were assumed to be average, but because 38 weeks could only partly outvote two years of evidence from the rest of the country. The four large regions barely moved under pooling, by 0.1 at most, because their own data was strong enough to hold its ground. That asymmetry is the whole point: the method shrinks what is uncertain and leaves alone what is not.
The verdict
This one helps, with a nuance. The regional split changed: €230k a year moved from the North-West and North-East to the South and Centre, within limits of 30% per region so the plan stayed in the range each region had seen. Projected on the regional returns, that is about €370k more revenue a year, and about €180k if every region sits at the low end of its interval.
The Islands were left at their population share, not raised. Their pooled 2.6 is encouraging, but its interval still reaches 1.3, and another 26 weeks will tell more than any model can now. If the brand wants an answer sooner, a regional holdout there is cheap and quick.
The reallocation will be read the way the pet-food plan was: a quarter later, region by region, against the low end of its own range. It is the optional last step of the Media Effectiveness Path because not every file carries a region column. When one does, it is often where the largest move is hiding.
The lesson
An average is a fair summary only when the parts agree. If your file has regions, ask how much they differ before you plan on the national number, and let the thin regions borrow strength from the country rather than letting their noise set the budget.
tea, the product
Your file, this question
Fifteen analyses on a CSV of weekly data, with the intervals and the diagnostics shown, and a plain sentence when the data cannot answer. Free while in beta, by invitation.
Request a place in the beta→tea, the product
Fifteen econometric analyses on your own CSV: Geo / Segment MMM, saturation curves, elasticities, budget allocation. Intervals and diagnostics shown, and a plain sentence when the file cannot answer.
Free while in beta, by invitation.
Request a place in the beta →Liked this? Run it on your own data.
tea runs Geo / Segment MMM and fourteen other analyses on any weekly CSV, in minutes. Free while in beta, by invitation.
The Media Effectiveness Story
- Adstock and the outdoor burst that was judged on the wrong week
- Why flat always-on spend makes carryover impossible to measure
- A TV saturation curve fitted on only two spend levels
- Paid social past the bend: the saturation curve behind a cheap cut
- Contribution decomposition: when branded search harvests TV demand
- When a budget optimiser says move 60% into one channel
- A media budget reallocation, executed and read a quarter later
- Geo MMM: the national average that hid a north and south split