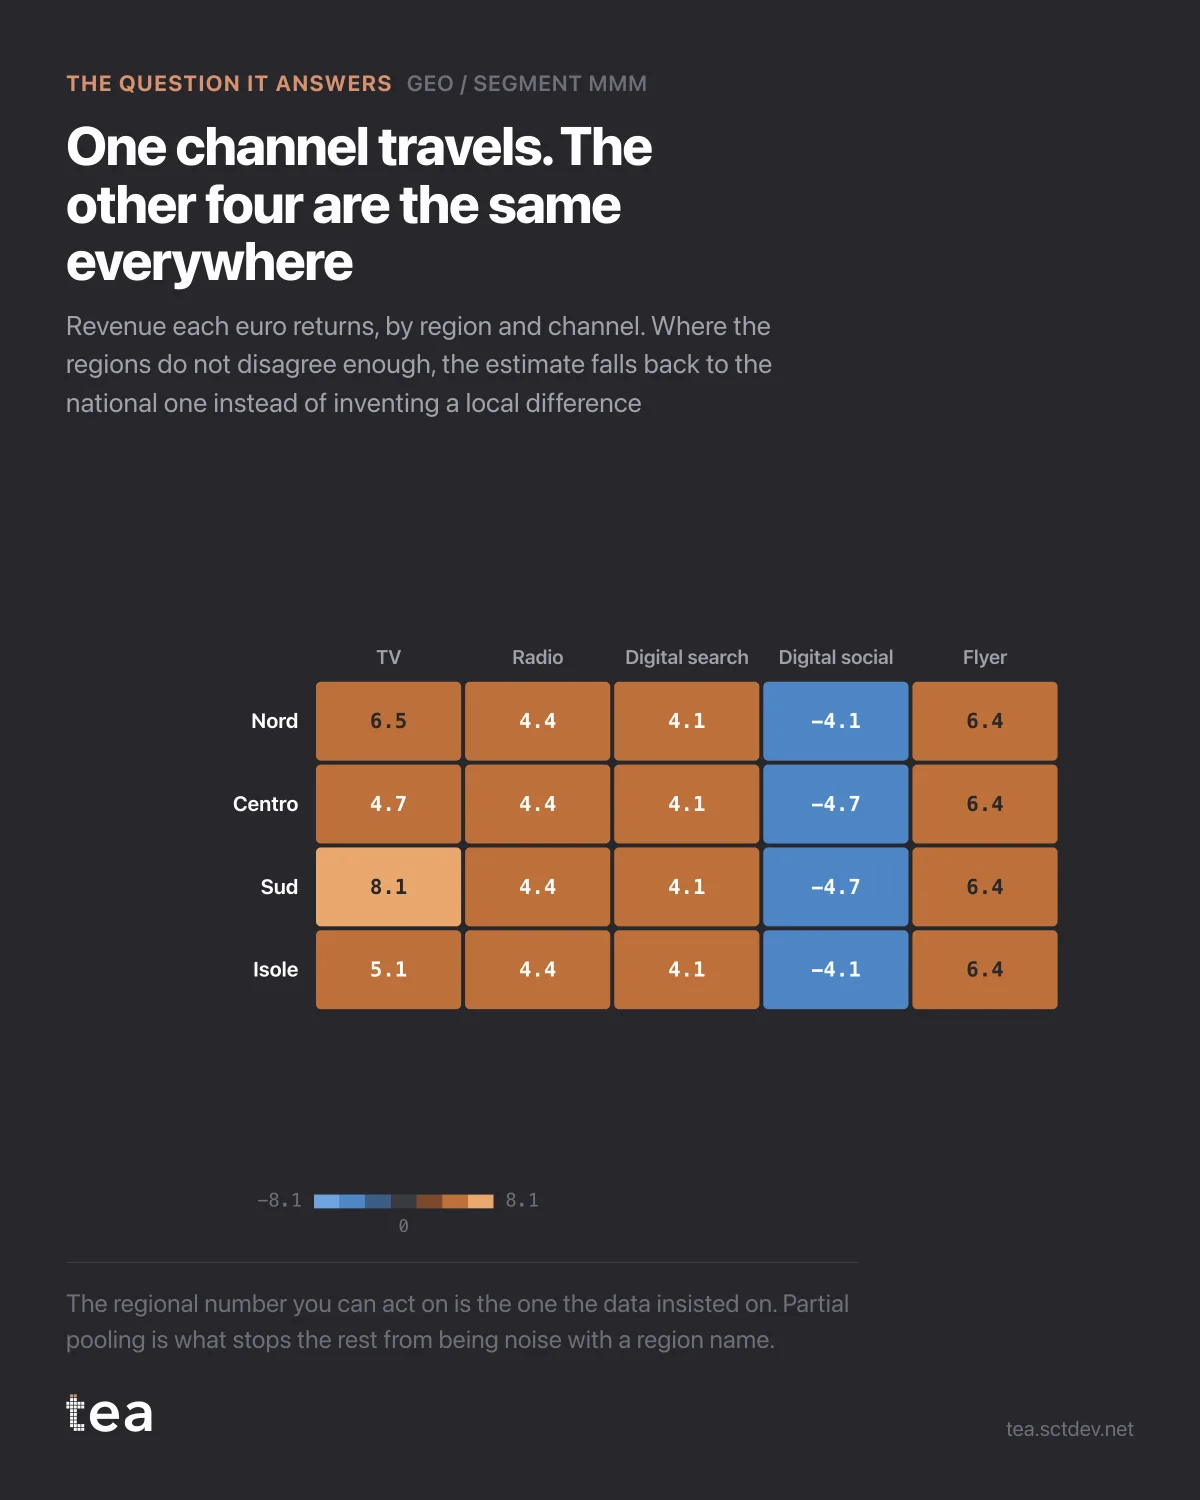
Four regions, five channels, and the grid shows what each euro returns in each cell.
Look along the rows and most of the numbers repeat. Radio returns 4.4 everywhere. Digital search 4.1 everywhere. Flyer 6.4 everywhere. Only TV changes: 8.1 in the south, 4.7 in the centre, with the north and the islands in between.
That is not the model being lazy. That is partial pooling doing exactly what it is for.
Here is the problem it solves. Fit each region separately and you get four independent estimates, each built on a quarter of the data, each with a wide interval, and each free to wander wherever its own noise takes it. Then somebody builds a regional plan on a difference that was never real. Fit them all together instead and you get one national number that hides every genuine local difference.
Partial pooling sits between the two. Each region's estimate is pulled toward the national mean, and how far it is pulled depends on how much evidence that region provides and how much the regions genuinely disagree. When a channel really does behave differently by region, the estimates separate. When the apparent difference is within what noise would produce, they collapse back to the national number.
So this grid is a map of where local evidence exists. TV has it. The other four channels do not, on this file, at this length of history.
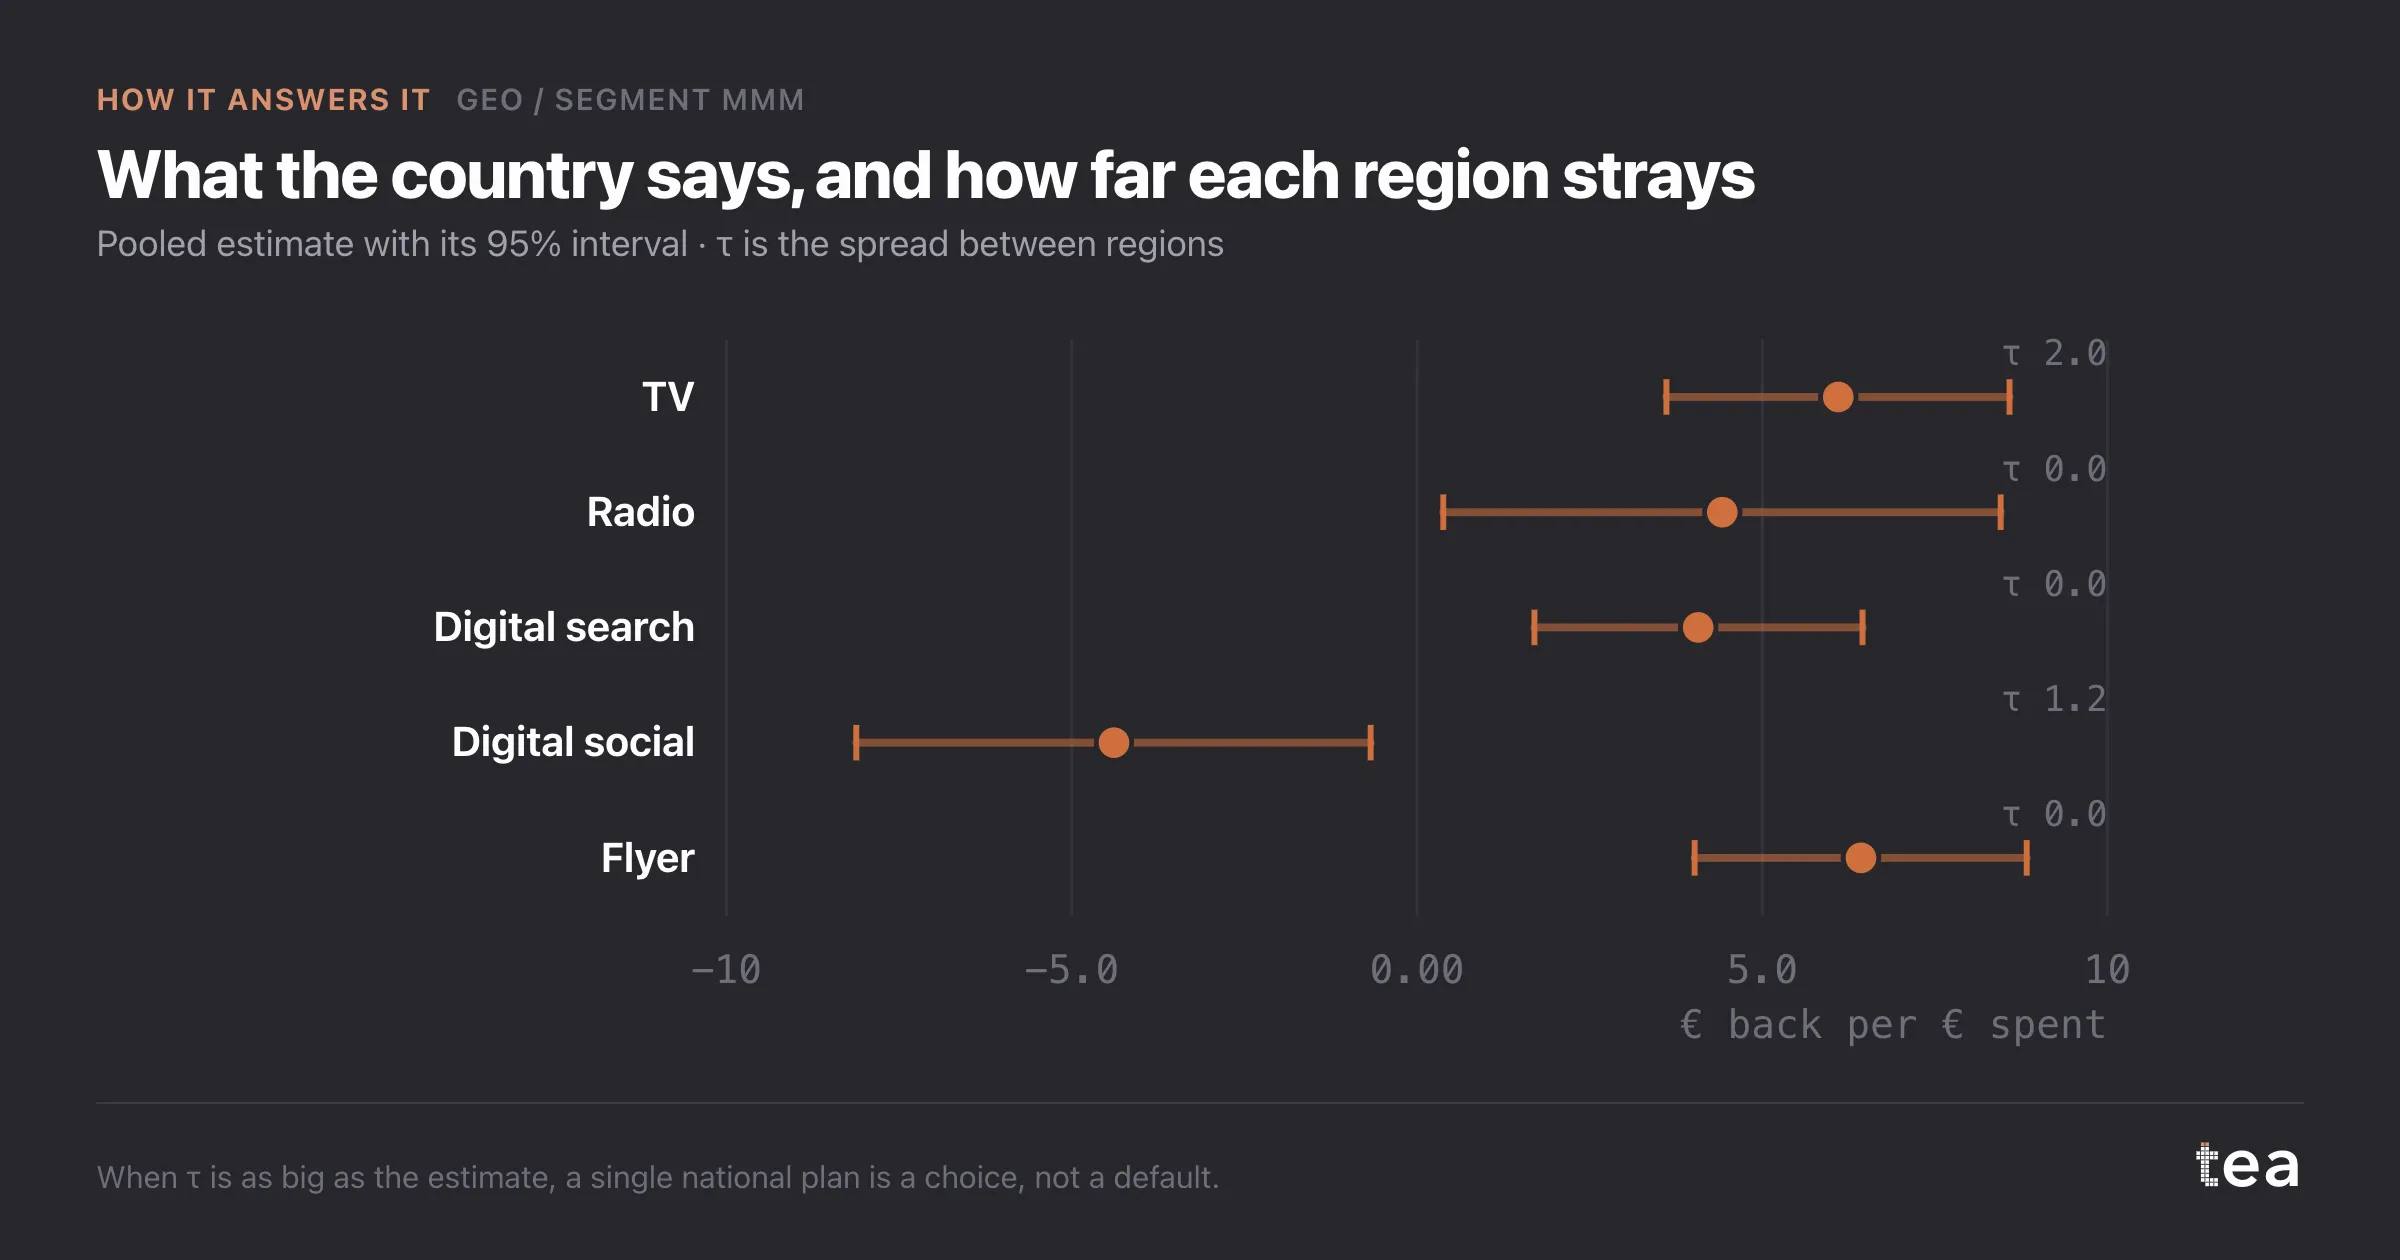
What that means for a plan is direct. You buy TV by region, because the difference is real and worth 3.4 points of return between the best and the worst. You buy the rest nationally, because the regional differences you would be planning against are not distinguishable from noise.
That is a much shorter and much safer plan than the one a set of four separate regressions would have produced.
The practical requirement is one column. The same weekly file you would use for a national model, with a region, city, store group or segment column added, and enough periods per segment that each one has something to say. Four regions over 104 weeks is 416 rows, which is comfortable.
What it gives back is a decision most teams make by instinct every year: how local should the plan be. Instinct usually answers with organisational structure, because there is a regional team, or with the loudest request. The variance in the data answers it differently and more cheaply.
And when the grid comes back entirely uniform, that is a result too. It means the national plan is the right plan, and you can stop spending management time on regional exceptions that the market does not support.
The chart is the actual output of Geo / Segment MMM in TEA, run on a sample file anyone can download.