Soft-drinks producer in Portugal, TV at €55k or €90k a week for two years, asking whether to go to €130k next summer.
A composite case, built from the kind of file we see most weeks. A soft-drinks producer selling through grocery in Portugal, about €1.1M of revenue in a typical week, with TV as the backbone of the plan for two years.
The TV plan was simple. Roughly €55k a week from October to May, roughly €90k a week in the summer months, never dark. Next summer the brand team wanted to push to €130k a week and needed to defend it. The question was: "Where does TV start to saturate, and is €130k past that point?"
What the data looked like
104 weekly rows. Revenue, TV spend, digital spend, an average shelf price, a temperature column and the usual holiday flags.
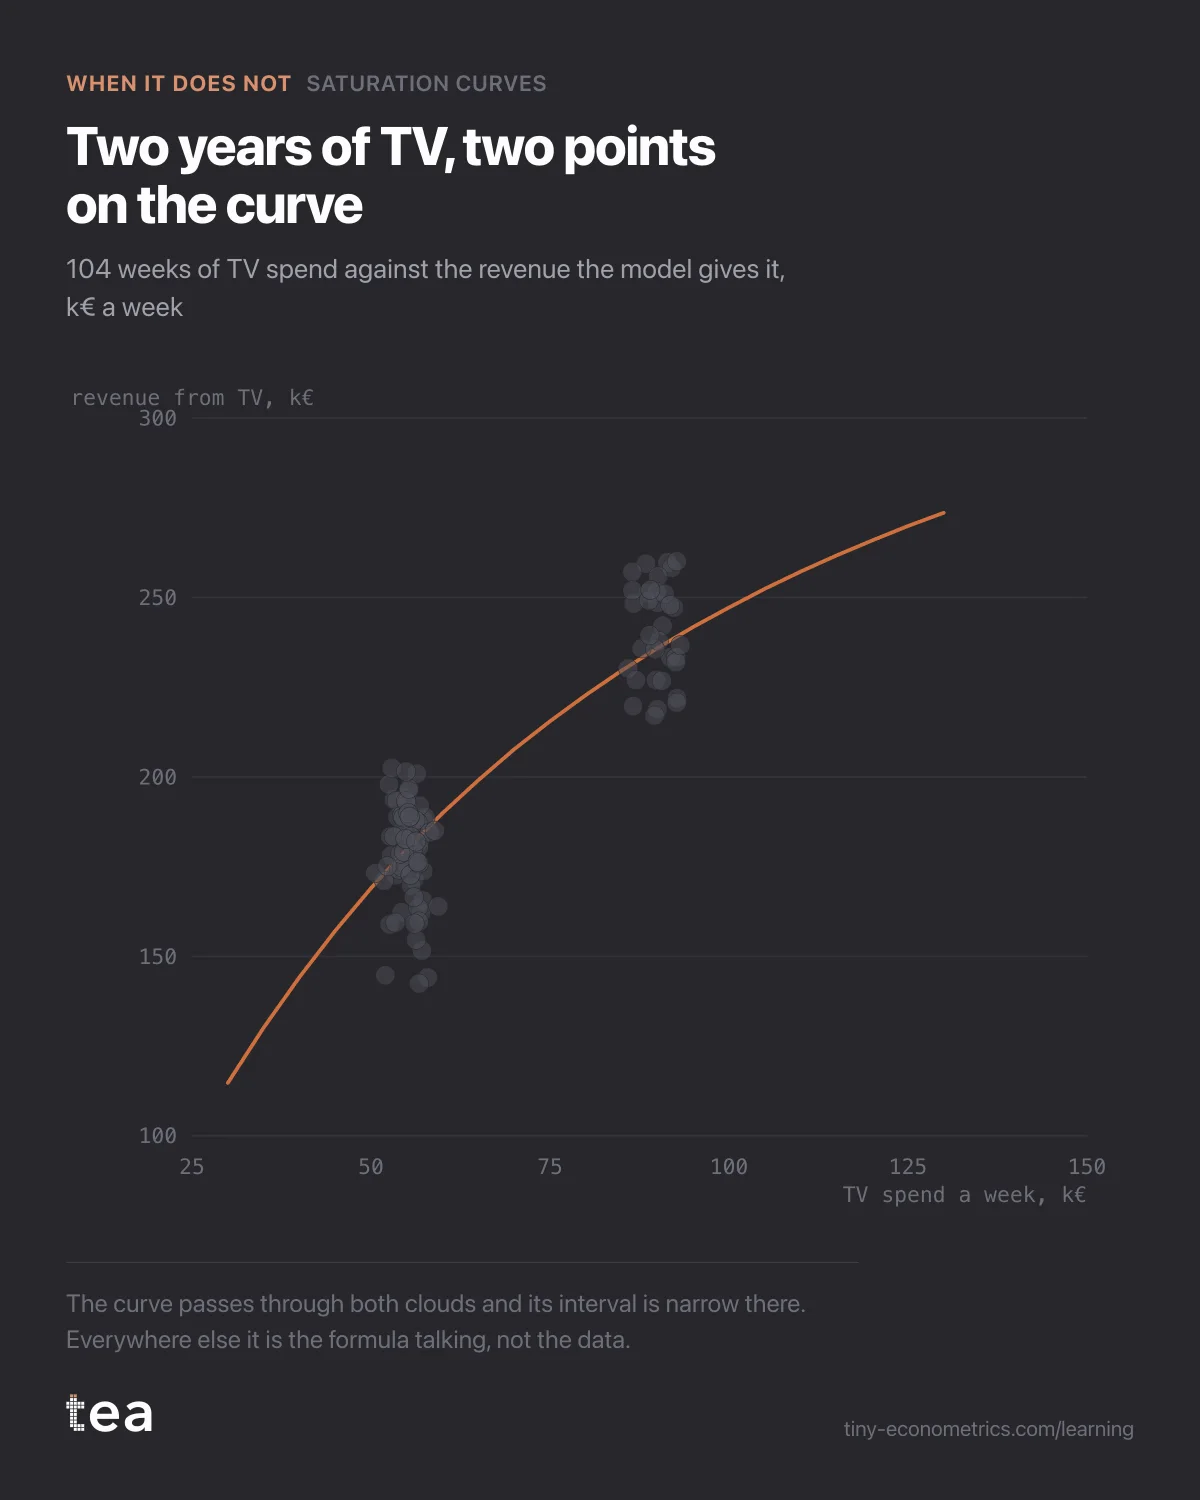
Lay the TV column on a chart and it is two clouds. Seventy weeks between €52k and €58k. Thirty-four weeks between €86k and €94k. Nothing below, nothing between, nothing above. The carryover had been estimated first, as the Media Effectiveness Path asks, so the spend was already spread over the weeks it worked in. That smoothing barely changed the picture: two levels, in practice.
And the €90k weeks were all summer weeks, which in soft drinks are also the weeks of highest demand.
What the curve did
Saturation Curves fits a Hill curve to the response: revenue rises with spend, bends at a half-saturation point, then flattens. The shape needs at least three numbers: the ceiling, the point of the bend, and how sharp the bend is.
Two clouds of points pin down two places on the curve. They do not pin down three numbers. Infinitely many Hill curves pass through both clouds, and they disagree about everything outside them.
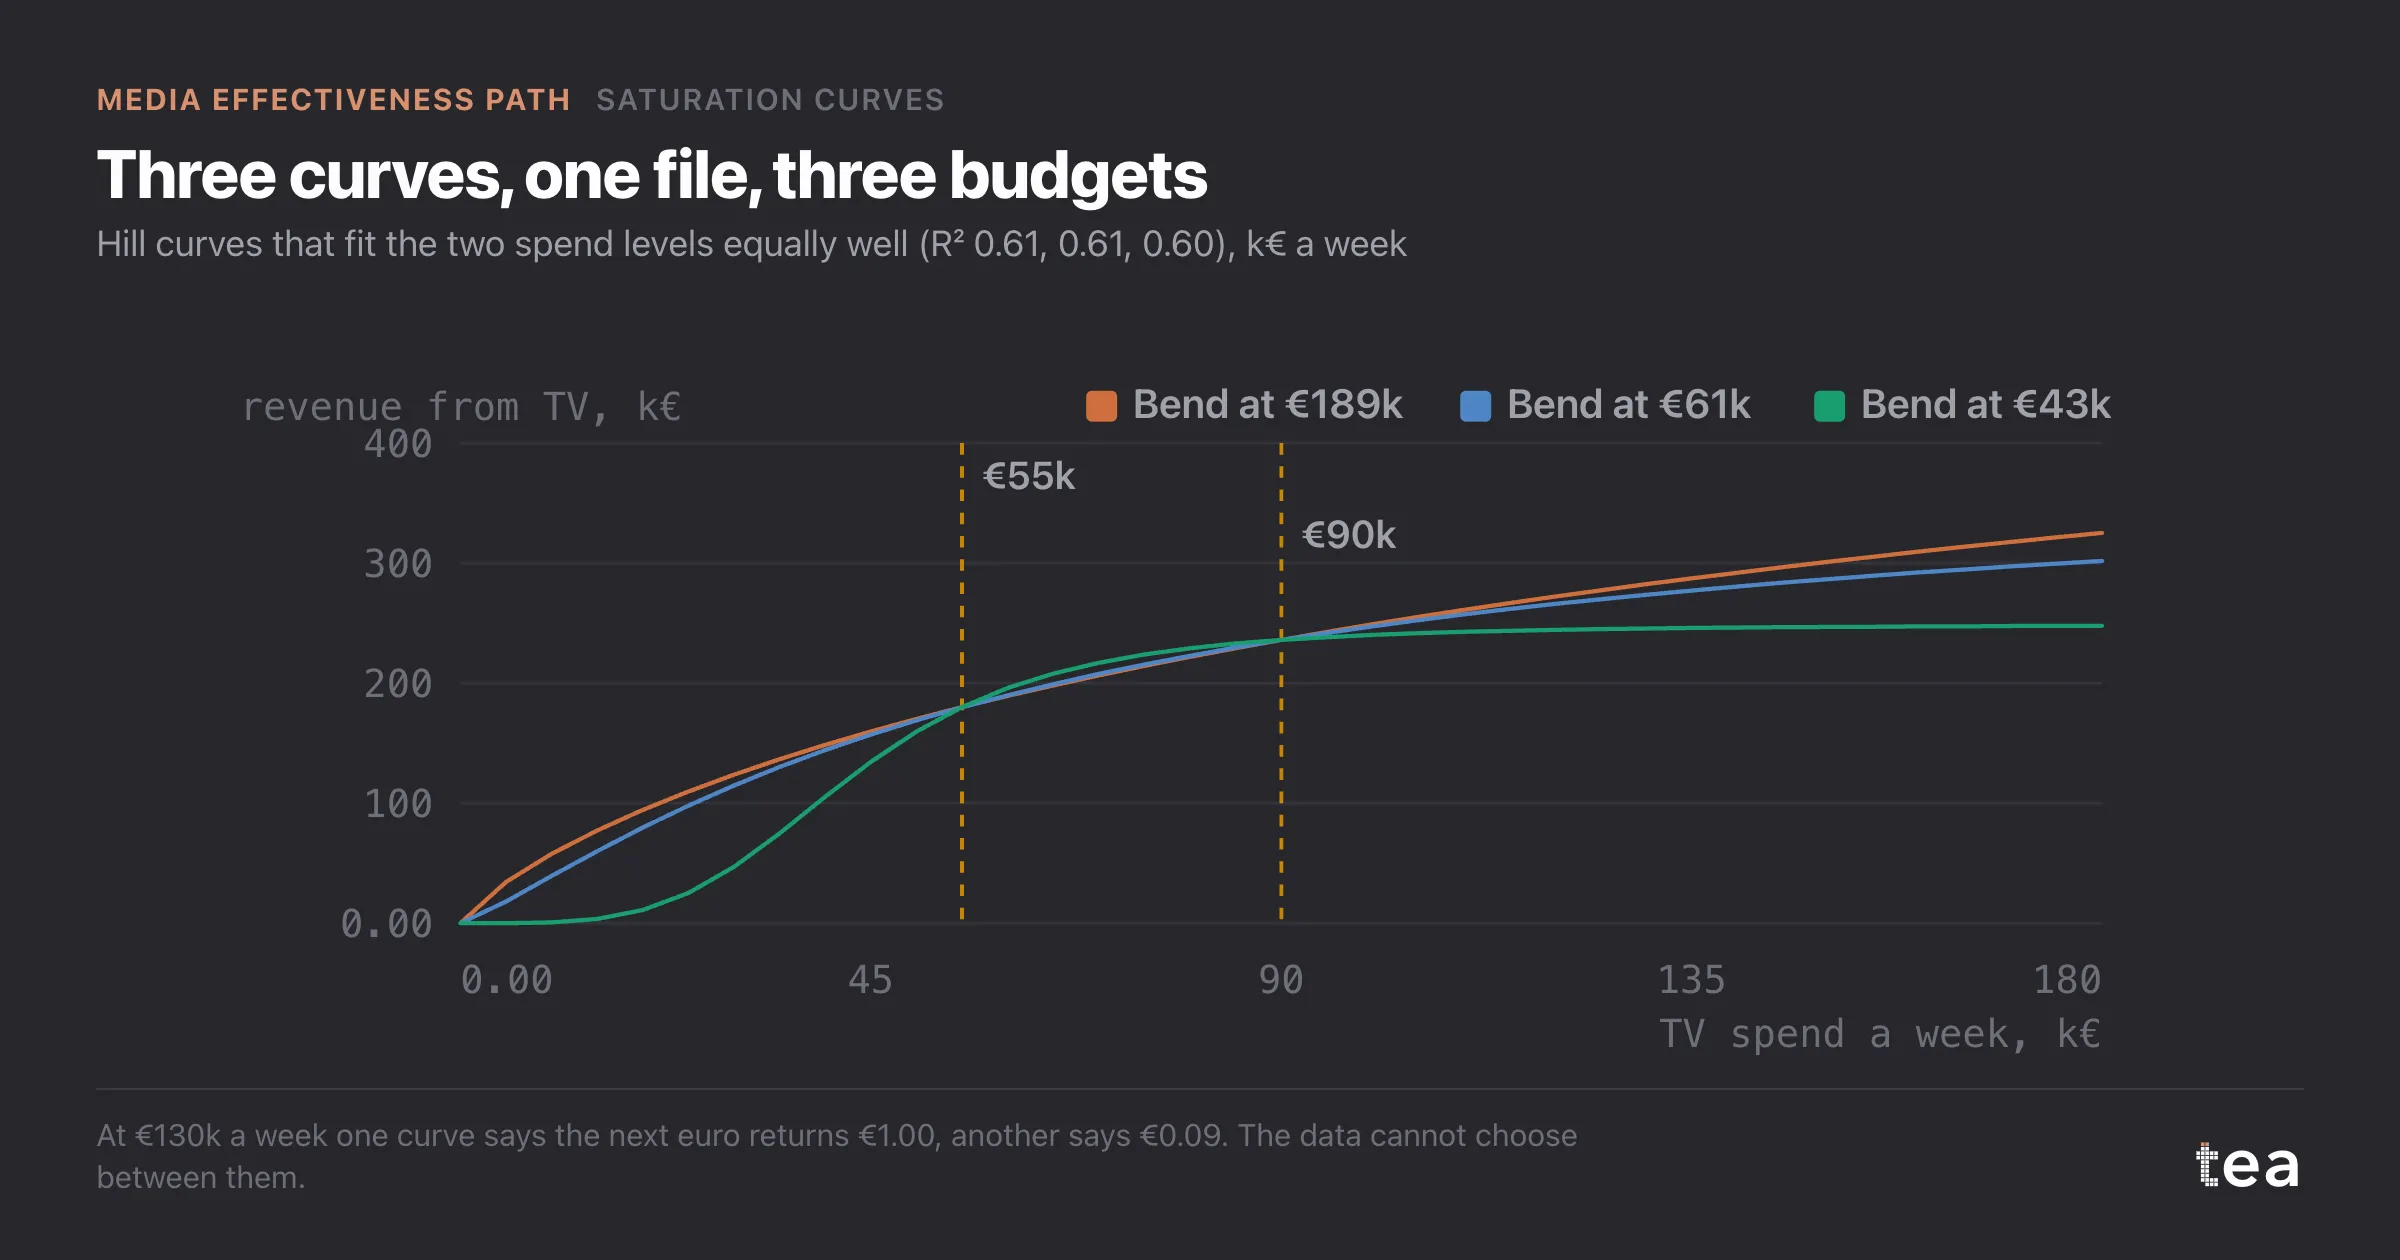
The default fit looked respectable. An R² of 0.61, a bend at €61k a week, and with the shape held at its best value, an interval on the bend from €54k to €69k. On a slide that reads as a confident answer. It is not one. The interval is narrow because it is conditional on a shape the data never chose. Let the shape move and the same file is just as happy with a bend at €43k (R² 0.60) or at €189k (R² 0.61).
Those three curves agree within a few per cent at €55k and €90k. At €130k they part company. Going from €90k to €130k a week for a thirteen-week summer would add €520k of spend, and buy:
- €603k of revenue on the curve that bends at €189k;
- €490k on the one that bends at €61k;
- €124k on the one that bends at €43k.
One of those is a good summer, one is a mild loss, one is a waste of half a million. The file cannot say which.
There was a second issue underneath. Because €90k only ever happened in summer, the difference between the two clouds is also the difference between seasons. The model controls for temperature and a seasonal index, but how much of the jump from €55k to €90k belongs to TV and how much to the sun depends on how well those controls are specified. Two levels and one confounder is not a curve. It is a slope with an asterisk.
The verdict
This does not help, and it would have been easy to pretend it did. The software returned a curve, an R² and an interval, and all three were technically correct. Forced into a recommendation, the default curve would have said €130k is past the bend but still marginally positive, and the brand team would have taken that into the budget meeting as evidence. It was a choice of formula dressed as a finding.
What to do instead is unglamorous and cheap:
- Vary spend on purpose. Over the next 26 weeks, buy TV at six levels from €30k to €120k a week, in an order that is not tied to the season, with the same total as last year. Include two dark fortnights.
- Test the summer step in part. If the brand wants more summer weight, go to €110k for six weeks, not €130k for thirteen, and read it before committing the rest.
- Use judgement for this summer. For the decision that cannot wait, the honest input is experience and the cost of being wrong, not a curve.
With half a year of varied spend, the same analysis on the same channel becomes useful. The carryover was measurable here because bursts existed. Saturation needs the equivalent in the other direction: levels.
The lesson
A response curve is only as wide as the spend you have tried. If two years of buying covered two levels, you have two points and a formula, and the formula is doing all the talking past them.
The Media Effectiveness Path
- Adstock and the outdoor burst that was judged on the wrong week
- Why flat always-on spend makes carryover impossible to measure
- A TV saturation curve fitted on only two spend levels
- Paid social past the bend: the saturation curve behind a cheap cut (out October 11, 2026)
- Contribution decomposition: when branded search harvests TV demand (out October 16, 2026)
- When a budget optimiser says move 60% into one channel (out October 21, 2026)
- A media budget reallocation, executed and read a quarter later (out October 26, 2026)
- Geo MMM: the national average that hid a north and south split (out October 31, 2026)