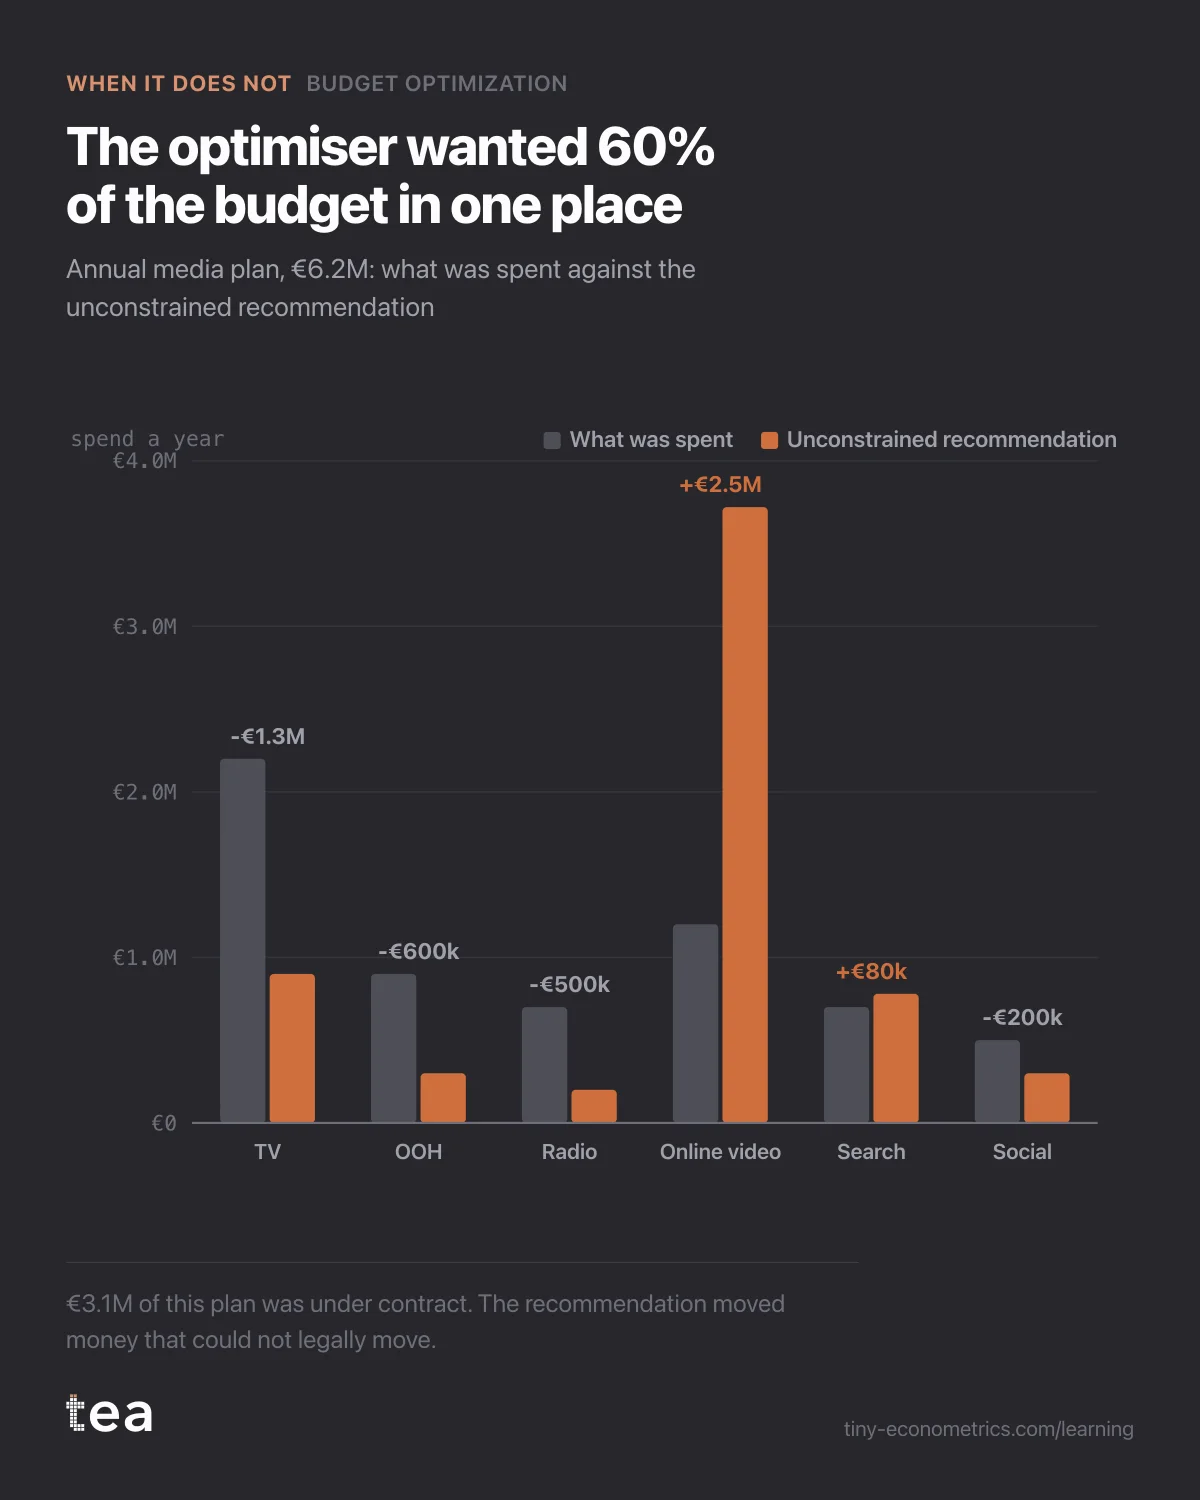
Consumer electronics retailer in the Netherlands, €6.2M of media a year, asking whether to follow an unconstrained reallocation.
A composite case, built from the kind of file we see most weeks. A consumer electronics retailer in the Netherlands, 60 stores and a large web shop, €6.2M of media a year: €2.2M on TV, €1.2M on online video, €0.9M on outdoor, €0.7M each on radio and paid search, €0.5M on social.
Someone on the team had run every channel through the Media Effectiveness Path and pressed the last button with no constraints. The optimiser came back with a striking plan. Online video from €1.2M to €3.72M, 60% of the whole budget. TV down to €0.9M, outdoor to €0.3M, radio to €0.2M. Projected uplift on modelled revenue: 17.6%, on the same total.
The question that reached us was almost a dare: "The model says 17.6%. Why would we not do it?"
What the data looked like
104 weekly rows, six channels, revenue, a price index and promotion flags. Carryover and saturation curves had been fitted per channel, and the decomposition was sound.
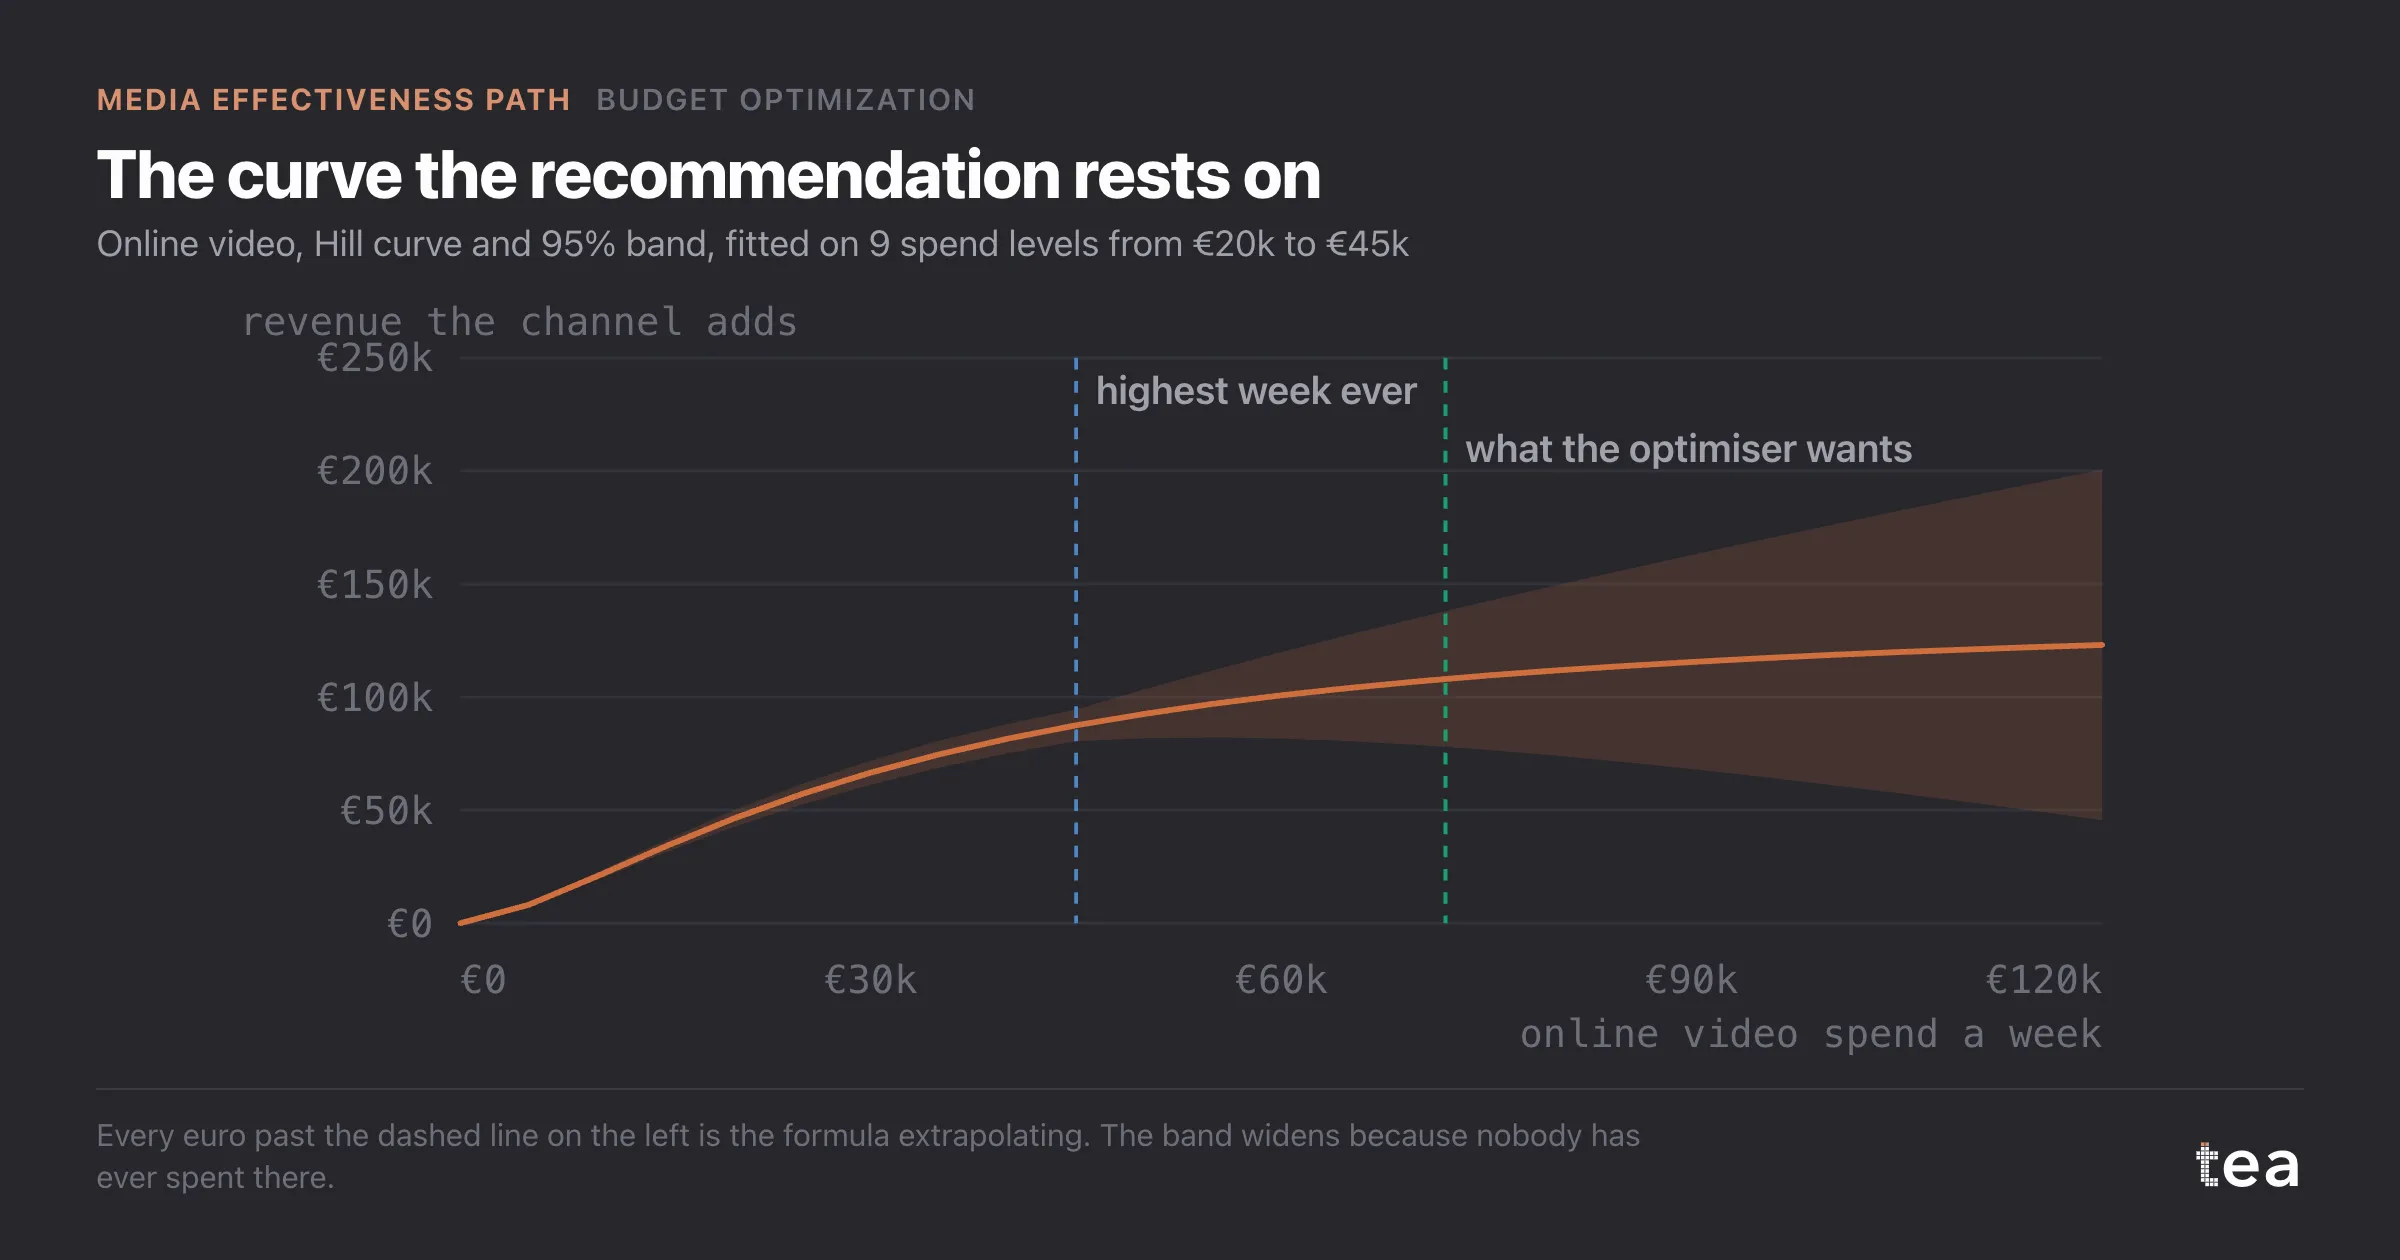
Online video, the channel the plan leaned on, had been bought in fixed packages. Over two years it had run at just nine distinct weekly levels, all between €20k and €45k a week. Nine levels is far better than the two levels of the TV case, and inside that range the curve was well behaved, with a bend around €32k.
The plan asked for €3.72M a year, about €72k a week on average. That is 60% above the highest week ever bought.
There was a second fact the file did not contain at all. TV was bought on an annual upfront deal worth €2.2M, and outdoor on a year-long contract worth €0.9M. €3.1M, half the budget, could not move this year whatever any model said.
Why the recommendation must not be taken
Budget Optimization moves money between channels until the next euro buys the same amount everywhere. That rule is right. The trouble is what it does with a curve that has a steep, confident-looking region and nothing to stop it going further.
Up to €45k a week, the online video curve is data. Beyond €45k, it is the Hill formula extending itself. The 95% band, about plus or minus 8% inside the observed range, widens to plus or minus 28% at €72k and keeps widening. The optimiser does not see the band, it sees the central line, and the central line says online video at €72k still returns €0.51 of revenue on the next euro while TV, cut hard, looks cheap to lose. So it pours money into the one place where the model knows least.
Had the plan been followed, two things would have gone wrong. The contracted €3.1M would have been paid anyway, so the "cuts" to TV and outdoor would have been imaginary while the online video increase was real, and the total would have overrun by €1.9M. And the 17.6% would have been tested in a region of the curve where nobody had ever spent, with no way to tell a bad curve from a bad quarter.
What to do instead
Run the same optimiser with the constraints written in. Three were enough here:
- TV and outdoor locked at their contracted values;
- no channel more than 30% above or below last year;
- online video capped at a weekly level no more than a quarter above anything observed.
The constrained plan moved €360k: €210k out of radio and €150k out of social, into online video. Projected uplift: 3.4%, a fifth of the 17.6%, and the page priced each constraint: what it gives up, lifted on its own. The 3.4% is the number to take into the meeting, with that list beside it.
Then extend the curve on purpose. Eight weeks of online video at €55k to €60k in spring, read with the same analysis, tells you whether the next step is worth taking. When the TV upfront comes up for renewal, there will be a curve to negotiate with.
The lesson
An optimiser is only as good as the curves it stands on and the constraints it is told about. When it recommends moving most of the money into the place where you have the least data, it is not finding an opportunity. It is finding the edge of the file.
tea, the product
Your file, this question
Fifteen analyses on a CSV of weekly data, with the intervals and the diagnostics shown, and a plain sentence when the data cannot answer. Free while in beta, by invitation.
Request a place in the beta→tea, the product
Fifteen econometric analyses on your own CSV: Budget Optimization, saturation curves, elasticities, budget allocation. Intervals and diagnostics shown, and a plain sentence when the file cannot answer.
Free while in beta, by invitation.
Request a place in the beta →Liked this? Run it on your own data.
tea runs Budget Optimization and fourteen other analyses on any weekly CSV, in minutes. Free while in beta, by invitation.
The Media Effectiveness Story
- Adstock and the outdoor burst that was judged on the wrong week
- Why flat always-on spend makes carryover impossible to measure
- A TV saturation curve fitted on only two spend levels
- Paid social past the bend: the saturation curve behind a cheap cut
- Contribution decomposition: when branded search harvests TV demand
- When a budget optimiser says move 60% into one channel
- A media budget reallocation, executed and read a quarter later (out October 26, 2026)
- Geo MMM: the national average that hid a north and south split (out October 31, 2026)