Pet-food brand in Germany, €9.6M of media a year, asking whether the same budget could do more next year.
A composite case, built from the kind of file we see most weeks. A pet-food brand selling through German grocery and online, €9.6M of media a year across TV, online video, paid search, paid social and outdoor.
The budget for the next year was flat, and everyone knew it. The question was the one most marketing teams end up asking in October: "We are not getting more money. Can the same money do more?"
What the data looked like
130 weekly rows, two and a half years. Revenue, spend for each of the five channels, distribution, price, promotions and a temperature column that turned out to matter for wet food.
This file had what the previous case lacked. Every channel had moved over a wide range, for reasons unrelated to demand: launch bursts, a dark summer for TV, two social creative tests at very different weights, a search budget that was cut and restored. The carryover and saturation curves for all five channels had tight intervals inside the range they would be used in.
What the optimiser did
Budget Optimization starts from a simple idea. If the next euro in one channel buys more than the next euro in another, money should move from the second to the first, and it should keep moving until the next euro buys the same everywhere. That is what "optimal" means here: equal marginal returns, not maximum spend on the best channel.
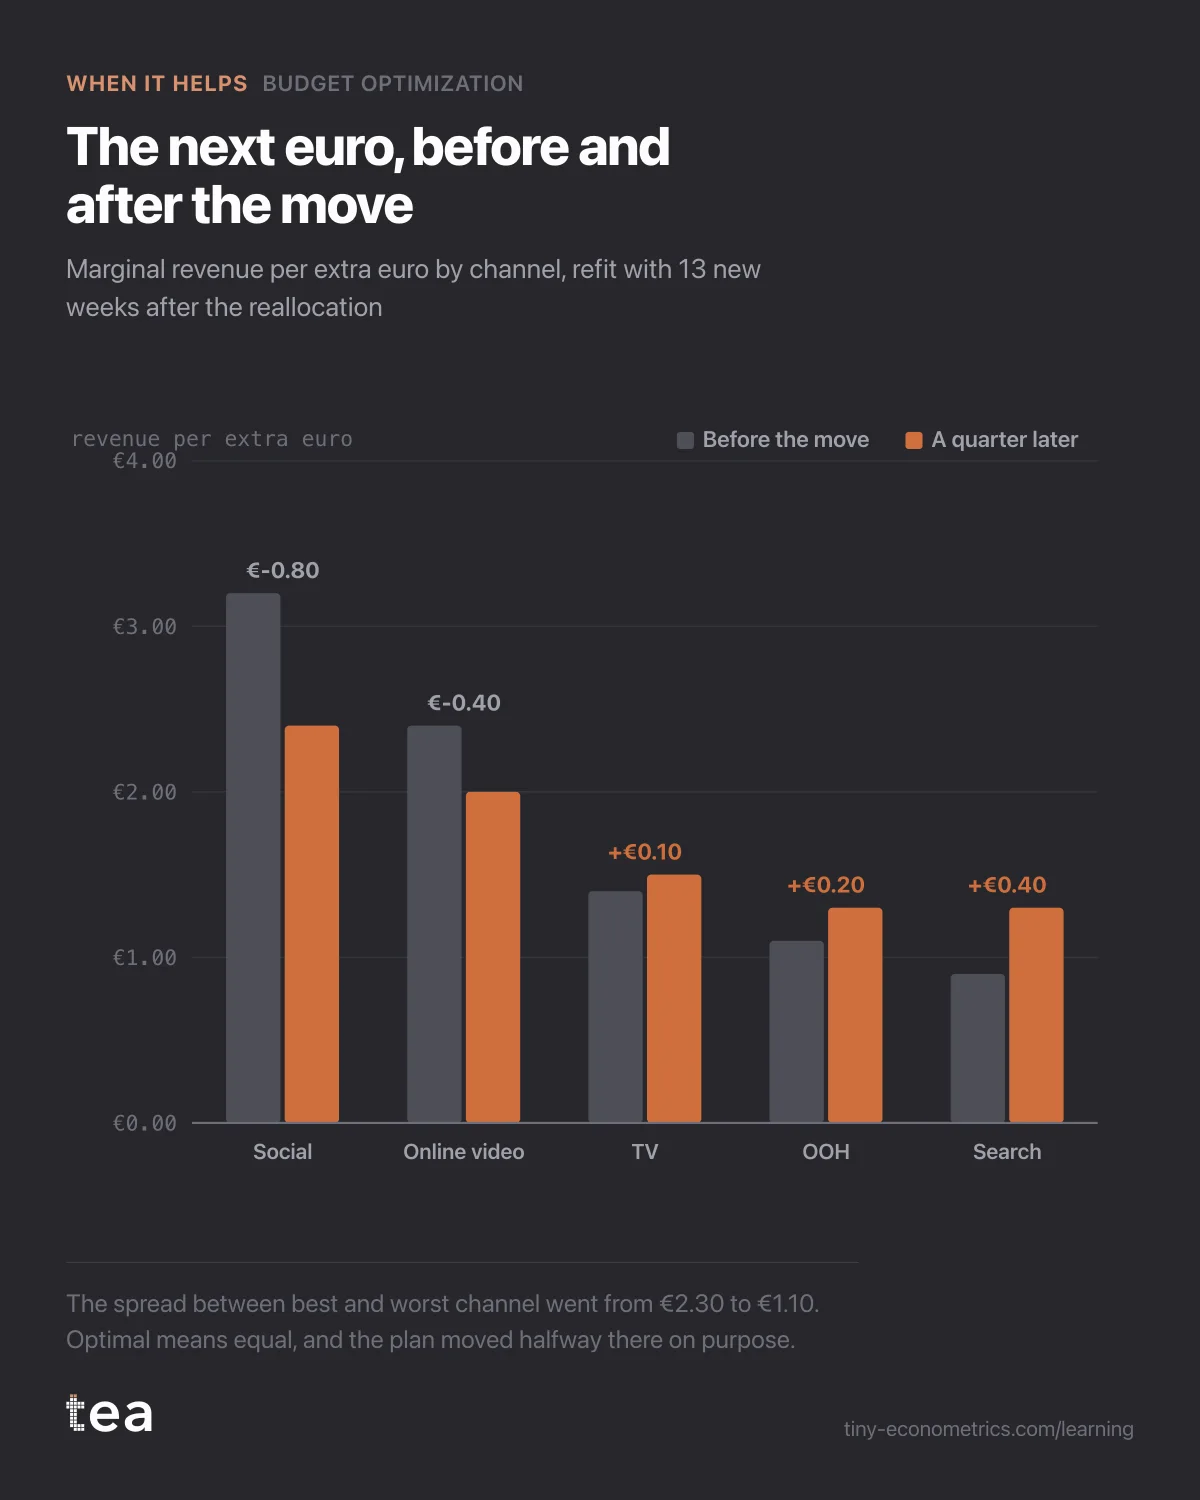
The curves from the saturation step gave the starting point. At current spend, the next euro returned:
- €3.20 of revenue in social;
- €2.40 in online video;
- €1.40 in TV;
- €1.10 in outdoor;
- €0.90 in search.
A spread that wide means money in the wrong places. The optimiser was run with constraints: TV no lower than 85% of its current level, because launches need reach; no channel more than 30% up or down; outdoor partly locked by contract.
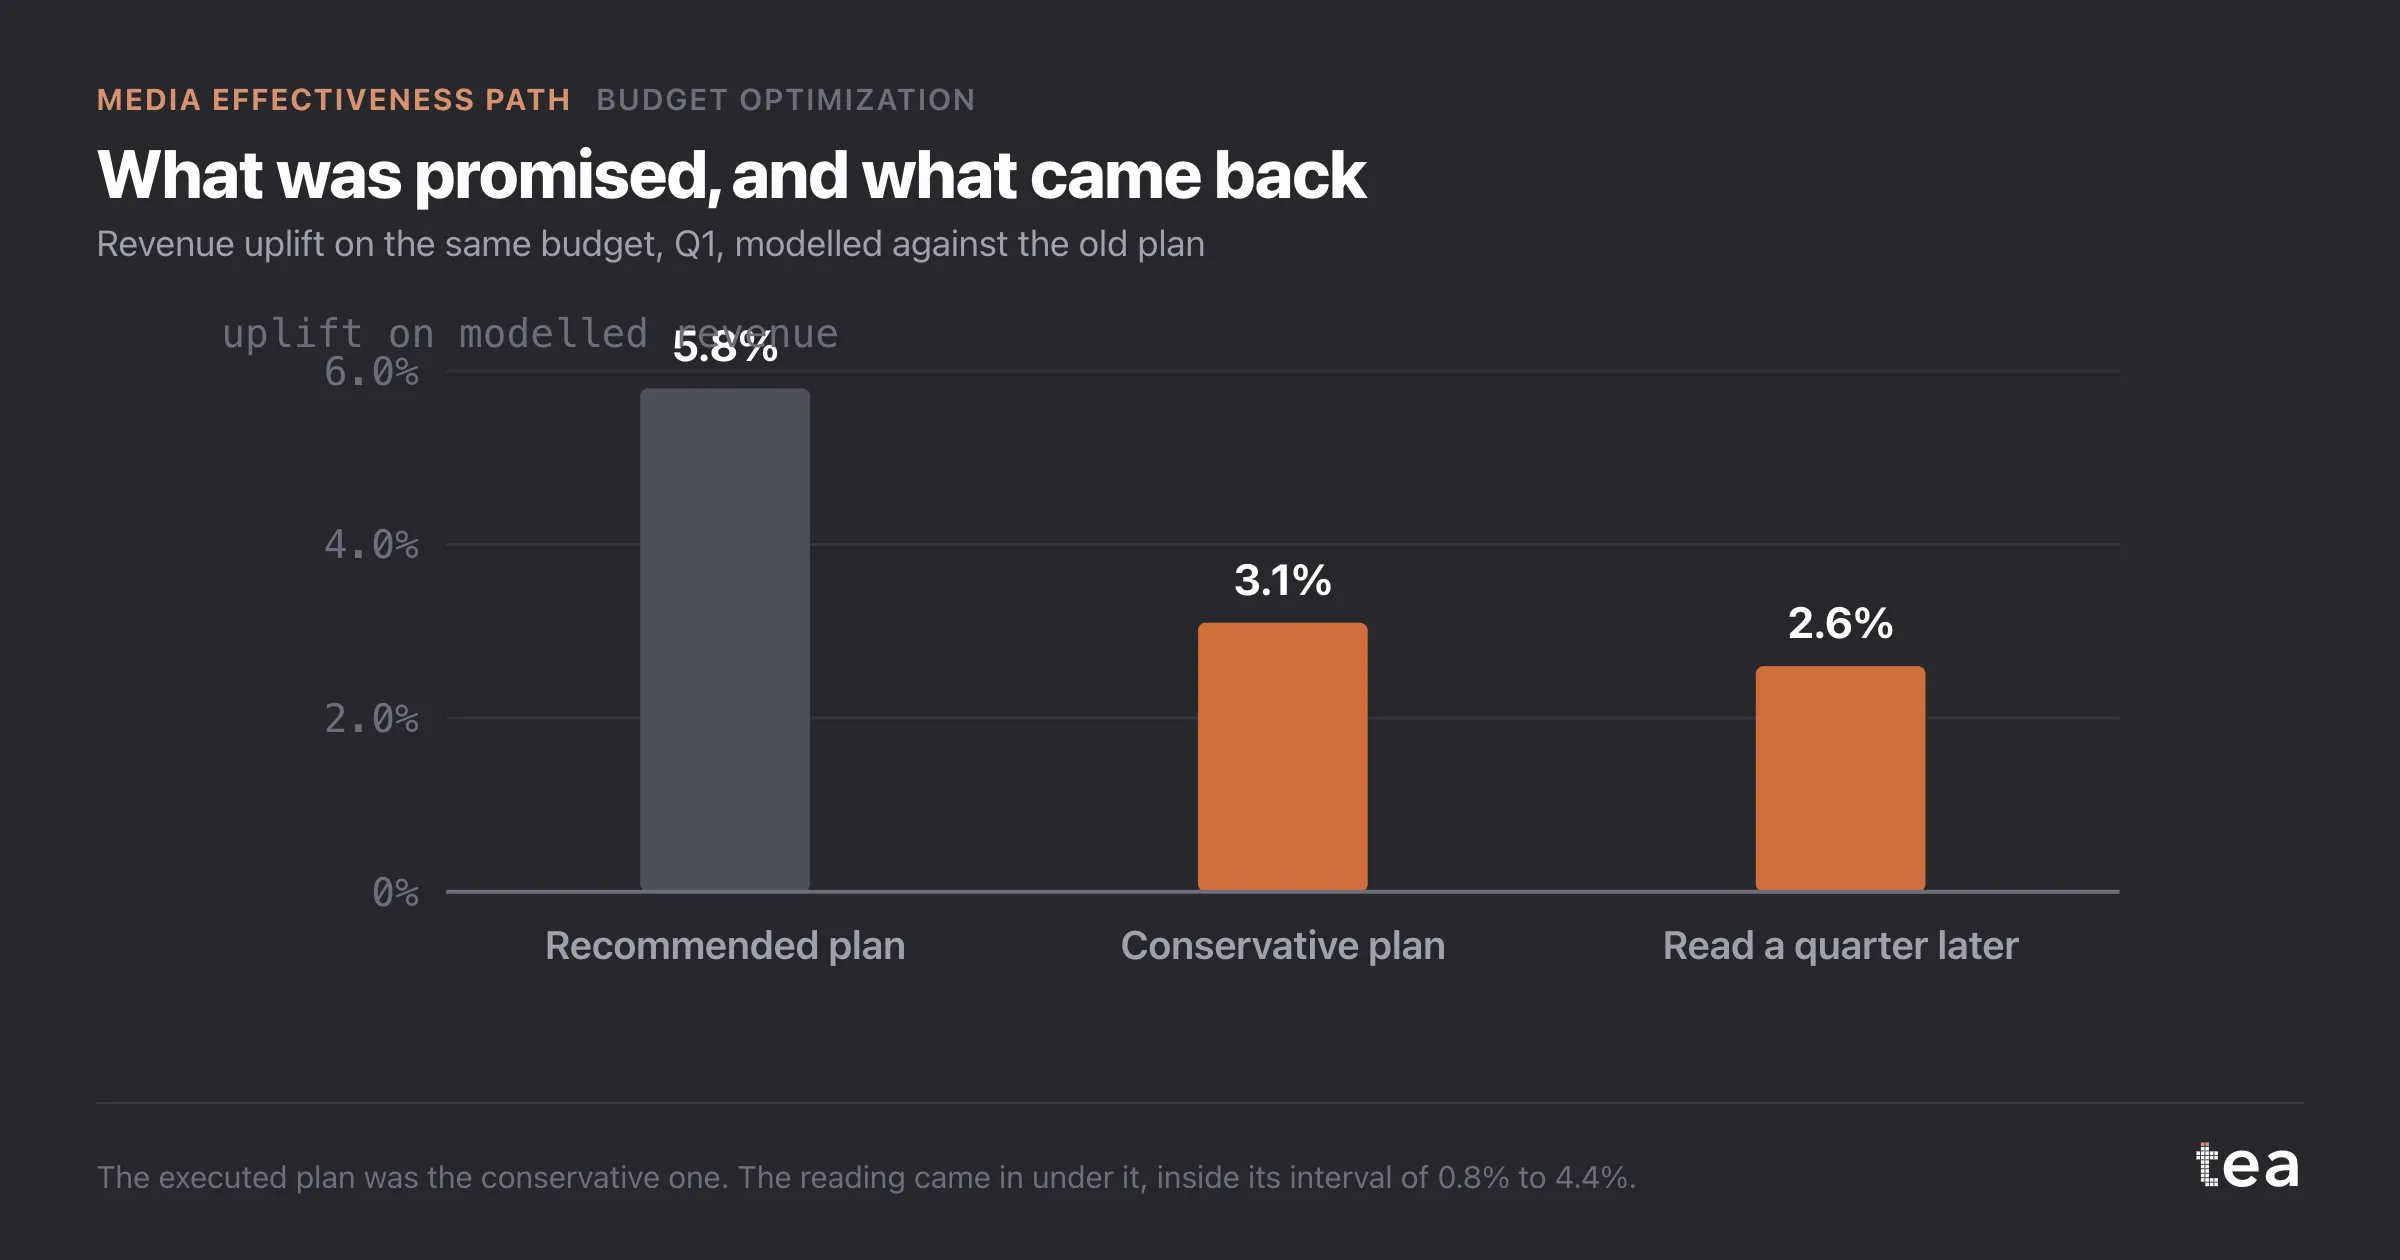
It produced a plan on the same quarterly budget of €2.4M that projected a 5.8% uplift on modelled revenue. The team then ran it a second time with tighter limits, every channel within 15% of its current level, to see what a first, smaller step would be worth. That plan projected 3.1%, and the page put a price on the limits: the 2.7 points of uplift given up to keep the move small.
What was executed, and what came back
The team executed the smaller plan, in the first quarter only. €410k of the €2.4M moved: €190k out of search, €120k out of outdoor and €100k out of TV, into social (€250k) and online video (€160k). Everything else stayed as planned, including creative and promotions, so the quarter could be read.
At the end of the quarter the model was refitted with the 13 new weeks. Two readings matter.
First, the marginal returns had moved towards each other, as the curves said they would. Social went from €3.20 to €2.40, because it was now higher on its curve. Search went from €0.90 to €1.30, because it was lower on its curve. The spread between best and worst channel fell from €2.30 to €1.10. Not equal, but halfway there, on purpose.
Second, revenue against the model's counterfactual of the old plan came in at plus 2.6%, with a 95% interval from 0.8% to 4.4%. Below the 3.1% of the smaller plan, comfortably inside the interval, and well below the 5.8% of the full one.
The verdict
This one helps, and the decision it changed is measurable: €410k a quarter moved, and about 2.6% more revenue on the same money, read rather than promised.
It is worth being plain about what the reading is. It is a model refitted on new weeks, not an experiment, and the interval says how much the number can move. What gives it weight is that every intermediate prediction held: the channels moved along their curves in the direction and roughly by the amount projected. A plan whose parts all behaved as expected is easier to trust than a headline.
Why the smaller plan? Because a recommendation of 5.8% would have been quoted, remembered and missed. The 3.1% was the one that could be defended, and the reading landed close enough to it to fund the second step. In the next quarter the brand moves another €300k in the same direction.
The lesson
Plan on the number of a step you can take, and execute in steps you can read. A reallocation that comes back at 2.6% against a promise of 3.1% builds the case for the next move. One that comes back at 2.6% against a promise of 5.8% ends the conversation.
tea, the product
Your file, this question
Fifteen analyses on a CSV of weekly data, with the intervals and the diagnostics shown, and a plain sentence when the data cannot answer. Free while in beta, by invitation.
Request a place in the beta→tea, the product
Fifteen econometric analyses on your own CSV: Budget Optimization, saturation curves, elasticities, budget allocation. Intervals and diagnostics shown, and a plain sentence when the file cannot answer.
Free while in beta, by invitation.
Request a place in the beta →Liked this? Run it on your own data.
tea runs Budget Optimization and fourteen other analyses on any weekly CSV, in minutes. Free while in beta, by invitation.
The Media Effectiveness Story
- Adstock and the outdoor burst that was judged on the wrong week
- Why flat always-on spend makes carryover impossible to measure
- A TV saturation curve fitted on only two spend levels
- Paid social past the bend: the saturation curve behind a cheap cut
- Contribution decomposition: when branded search harvests TV demand
- When a budget optimiser says move 60% into one channel
- A media budget reallocation, executed and read a quarter later
- Geo MMM: the national average that hid a north and south split (out October 31, 2026)