Home-furnishing retailer, 38 stores in northern Italy, asking whether a spring outdoor and radio burst had failed.
A composite case, built from the kind of file we see most weeks. A home-furnishing retailer with 38 stores across northern Italy, roughly €1.9M of revenue in an ordinary week, and a marketing team that had just been told its spring burst did not work.
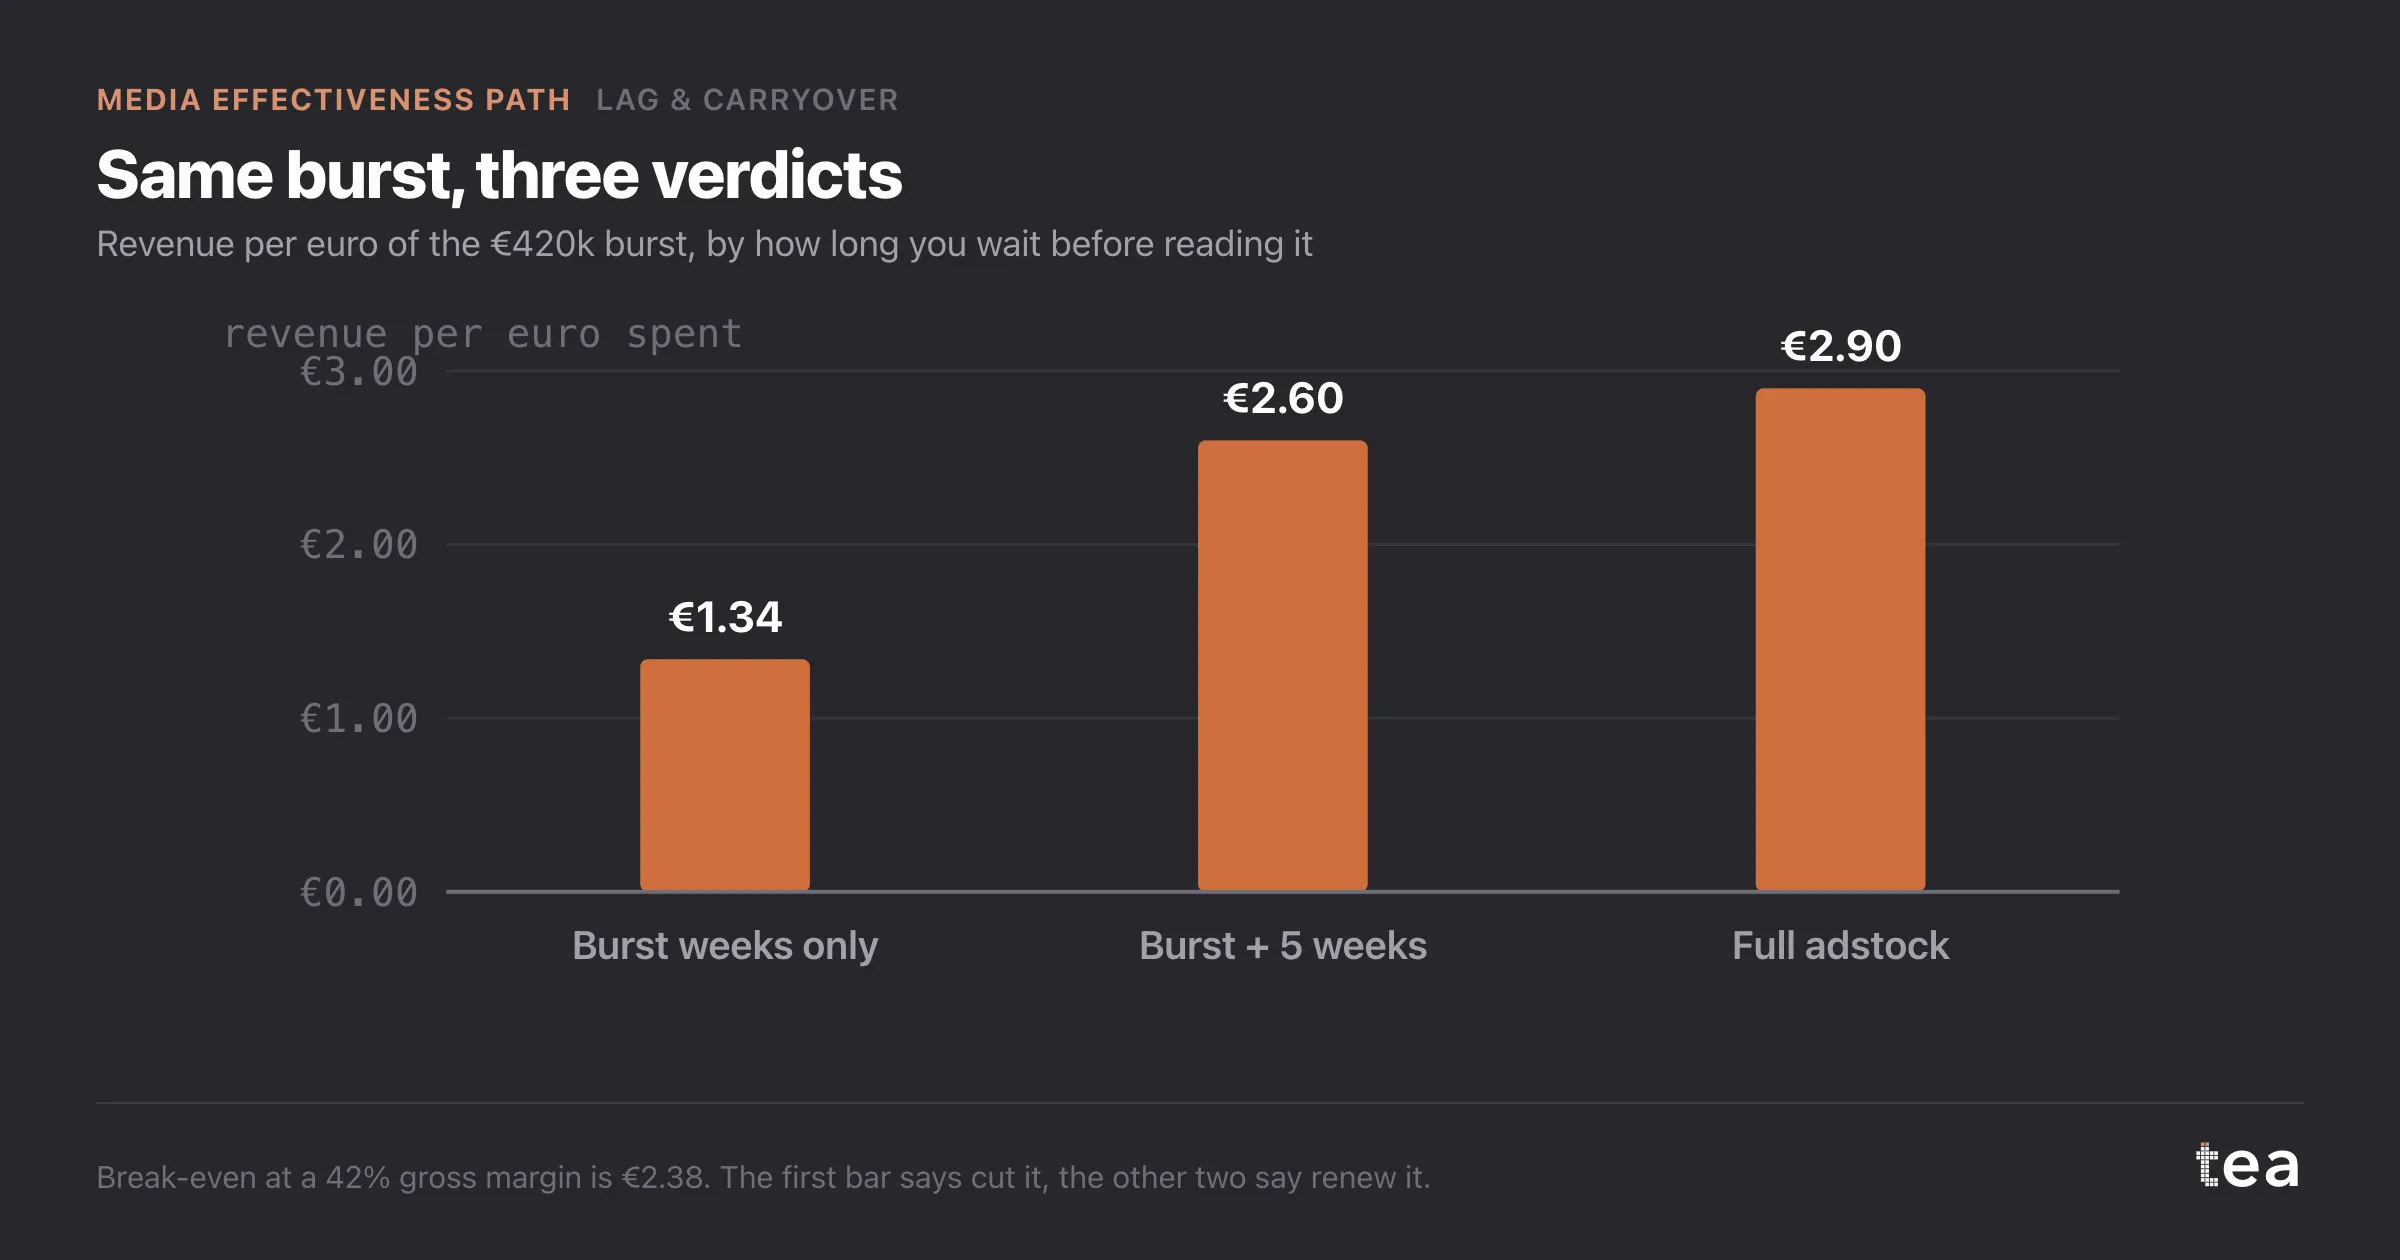
The burst was three weeks of outdoor posters and regional radio in March, €420k in total. The internal report read revenue during those three weeks against the same weeks of the previous year, net of promotions, and found €561k of extra revenue. That is €1.34 back for every euro spent. At a 42% gross margin the burst needed €2.38 per euro just to break even.
The question that reached us was short: "The March burst did not pay. Should the autumn money go to search instead?"
What the file looked like
Two years of weekly data, 104 rows. Store revenue, spend by channel (outdoor, radio, paid search, paid social), a promotion flag and a holiday flag. Store count did not change in the window, which removes one of the usual headaches.
The useful thing about this file was that outdoor and radio had run as four separate bursts over the two years, in different months, with quiet weeks in between. A burst followed by silence is exactly what you need to see how long an effect lasts, because the tail has nowhere to hide.
The less useful thing: outdoor and radio always ran together, in the same weeks, at roughly the same ratio. No model can split two channels that never moved apart. So we treated them as one burst and estimated one memory for the pair. The report said so on the first line, and so do I.
What the analysis did
Lag & Carryover fits a geometric adstock. The idea is simple: a euro spent this week has an effect this week, a slightly smaller one next week, a smaller one again the week after, each week a fixed fraction of the one before. That fraction is the decay rate, and it is estimated from your own series rather than borrowed from a benchmark table.
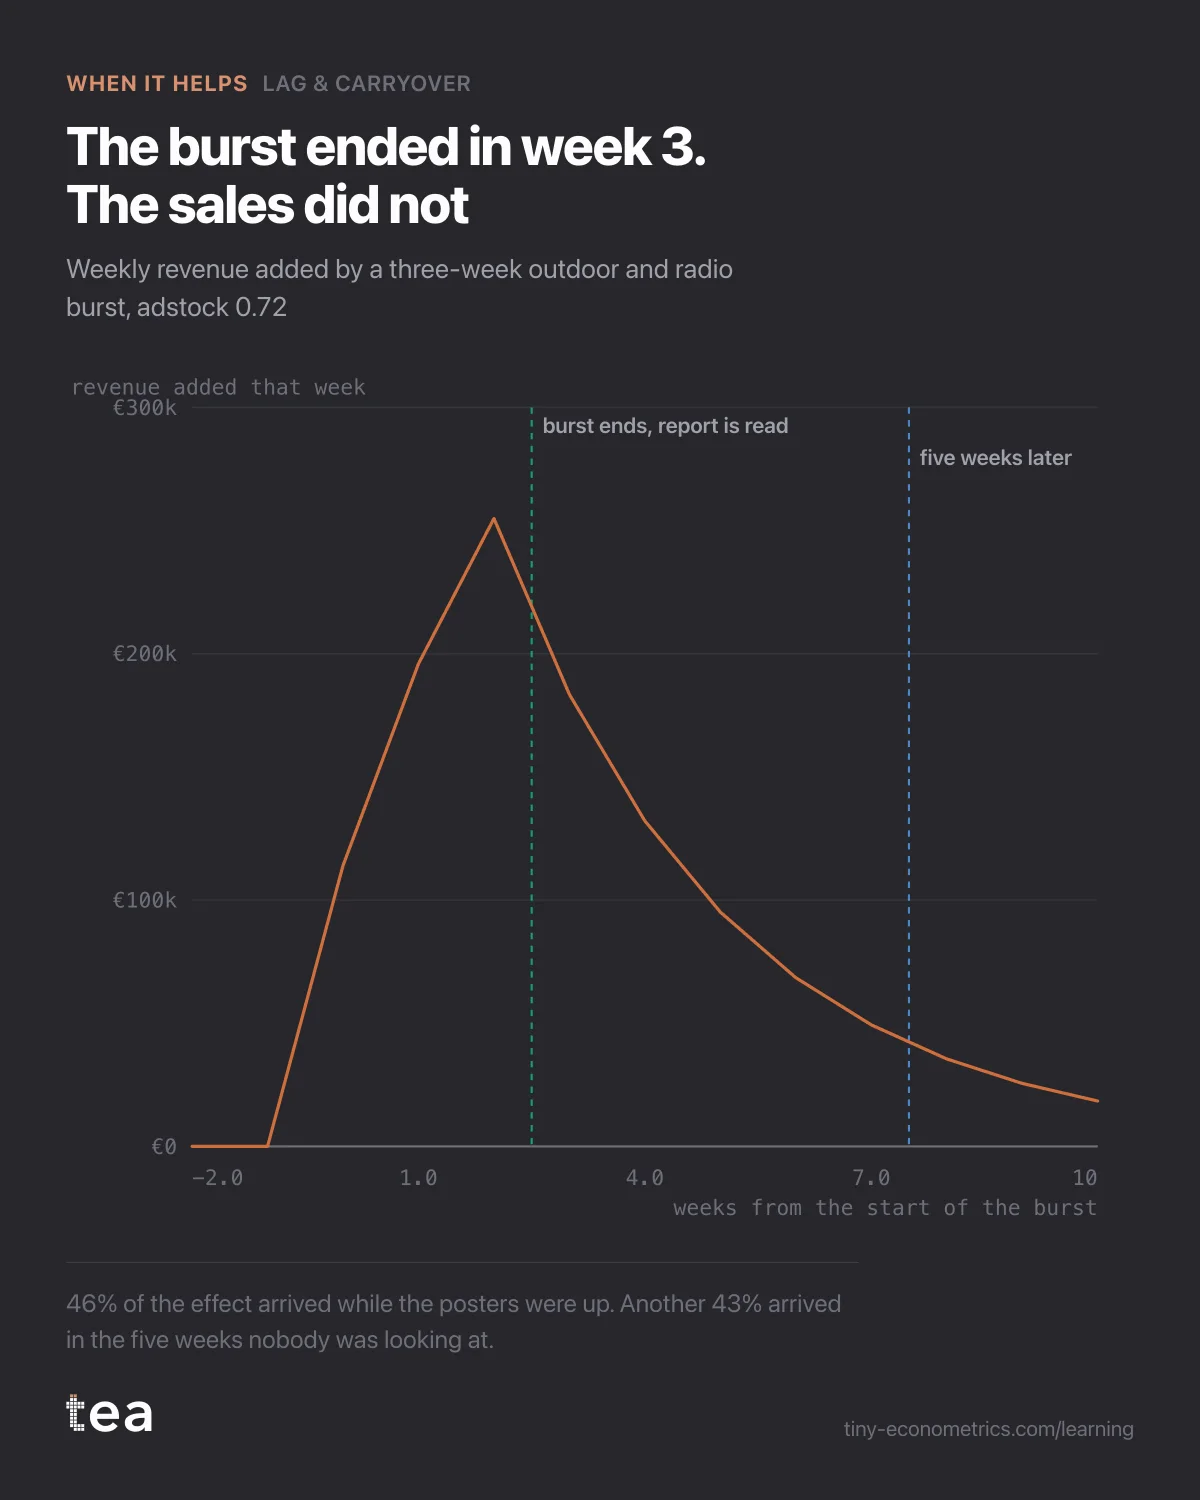
On this file the decay came out at 0.72 per week, with a 95% interval from 0.64 to 0.79. Translated: a half-life of 2.1 weeks, somewhere between 1.6 and 2.9. For furniture that is not surprising. Nobody buys a sofa the evening they hear an advert. They notice it, talk about it, measure the living room and visit a store a fortnight later.
Once the decay is known, the burst can be followed week by week after it ended. The total effect, summed over the whole tail, came to €1.22M of revenue, or €2.90 per euro. Of that:
- 46% arrived during the three weeks the posters were up;
- 43% arrived in the five weeks after they came down;
- the last 11% trickled in later still.
The internal report had read the first slice and called it the whole.
The verdict
This one helps, and the decision it changed is concrete. The autumn burst was renewed at the same €420k rather than moved to search, and the reading window was changed from "the weeks it ran" to "the weeks it ran plus five". Read that way, the March burst returns €2.60 per euro, above break-even, and the autumn one was judged on the same eight-week window when it came in.
It is worth saying what the analysis did not do. It did not prove the burst was a great investment. €2.90 per euro at a 42% margin is a modest profit, and the interval on the decay means the full figure could be somewhat lower. What it did was remove a measurement error that was always going to make outdoor look worse than it is. Same-week reporting does not favour good channels, it favours fast ones.
Two things are worth carrying into the next step of the Media Effectiveness Path. First, the 0.72 decay goes into every model that follows, so the saturation curves are fitted on spend as it actually works, spread over weeks, rather than on spend as it was booked. Second, the four bursts were all of similar size, which means this file tells us how long the effect lasts but very little about how big a bigger burst would be. That is a different question, with a different answer.
The lesson
Before you judge whether a channel worked, find out how long it takes to work. A report that reads a two-week half-life on a three-week window is measuring the clock, not the channel, and it will keep recommending you cut whatever is slowest.
The Media Effectiveness Path
- Adstock and the outdoor burst that was judged on the wrong week
- Why flat always-on spend makes carryover impossible to measure
- A TV saturation curve fitted on only two spend levels (out October 6, 2026)
- Paid social past the bend: the saturation curve behind a cheap cut (out October 11, 2026)
- Contribution decomposition: when branded search harvests TV demand (out October 16, 2026)
- When a budget optimiser says move 60% into one channel (out October 21, 2026)
- A media budget reallocation, executed and read a quarter later (out October 26, 2026)
- Geo MMM: the national average that hid a north and south split (out October 31, 2026)