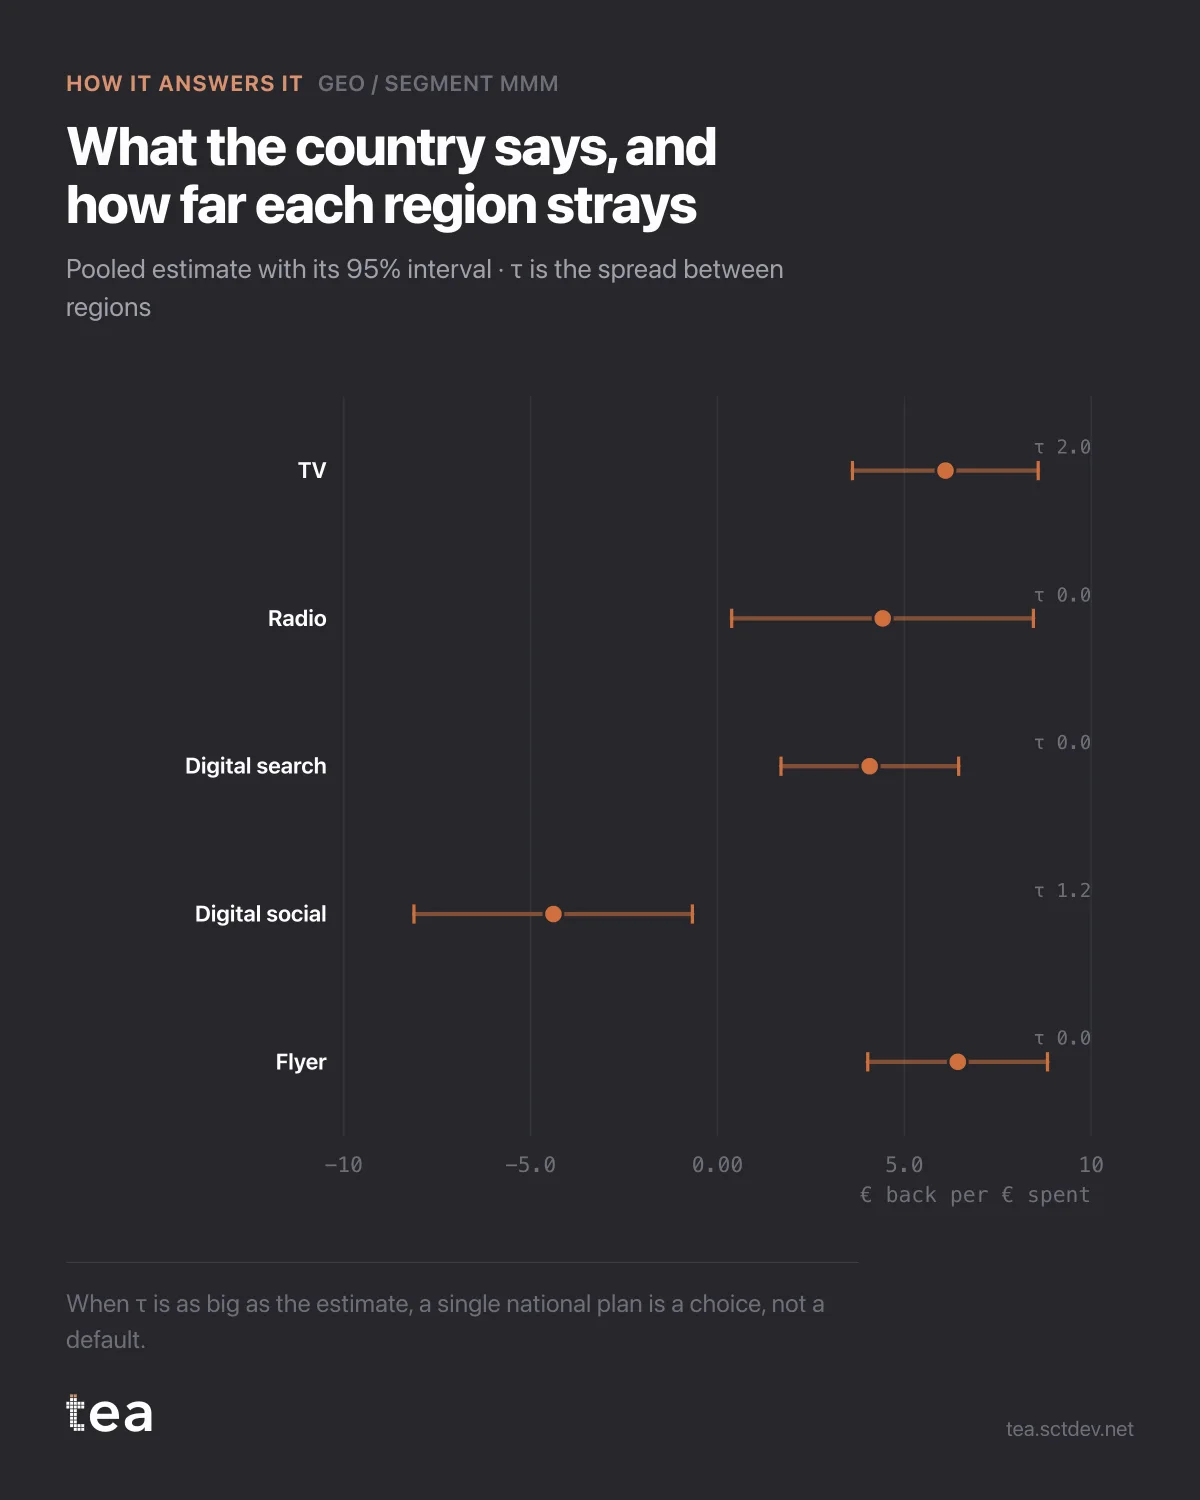
This is the chart that tells you whether a national number deserves to exist, and it has one column most people have never seen.
Each row is a channel with its pooled estimate and 95% interval. The label on the right is tau, the spread between regions.
Flyer: 6.43, tau 0. Digital search: 4.07, tau 0. Radio: 4.42, tau 0. TV: 6.10, tau 2.01.
Tau is the standard deviation of the true regional effects around the national mean, and it answers a question the mean cannot. A tau of zero says the regions do not differ beyond what noise explains, so the national number is the whole story. A tau of 2.01 against a mean of 6.10 says the regions genuinely differ by about a third of the effect size, and a single national plan is now a choice rather than a default.
Two estimates, two different jobs. The mean tells you what to expect. Tau tells you how wrong you will be in any individual region if you use the mean.
There is a third row worth pausing on. Digital social comes back at -4.39, with an interval that stays below zero. Taken literally that says spending there lowers revenue. Taken with the note the product prints, it says the channel has no positive ceiling in any segment under this model, and with correlated channels that usually means the model cannot separate it rather than that the channel does harm.
That distinction is the difference between cutting a budget and investigating a file. Negative coefficients in a media model are almost always a message about collinearity, and reading them as instructions is how a working channel gets killed by a regression.
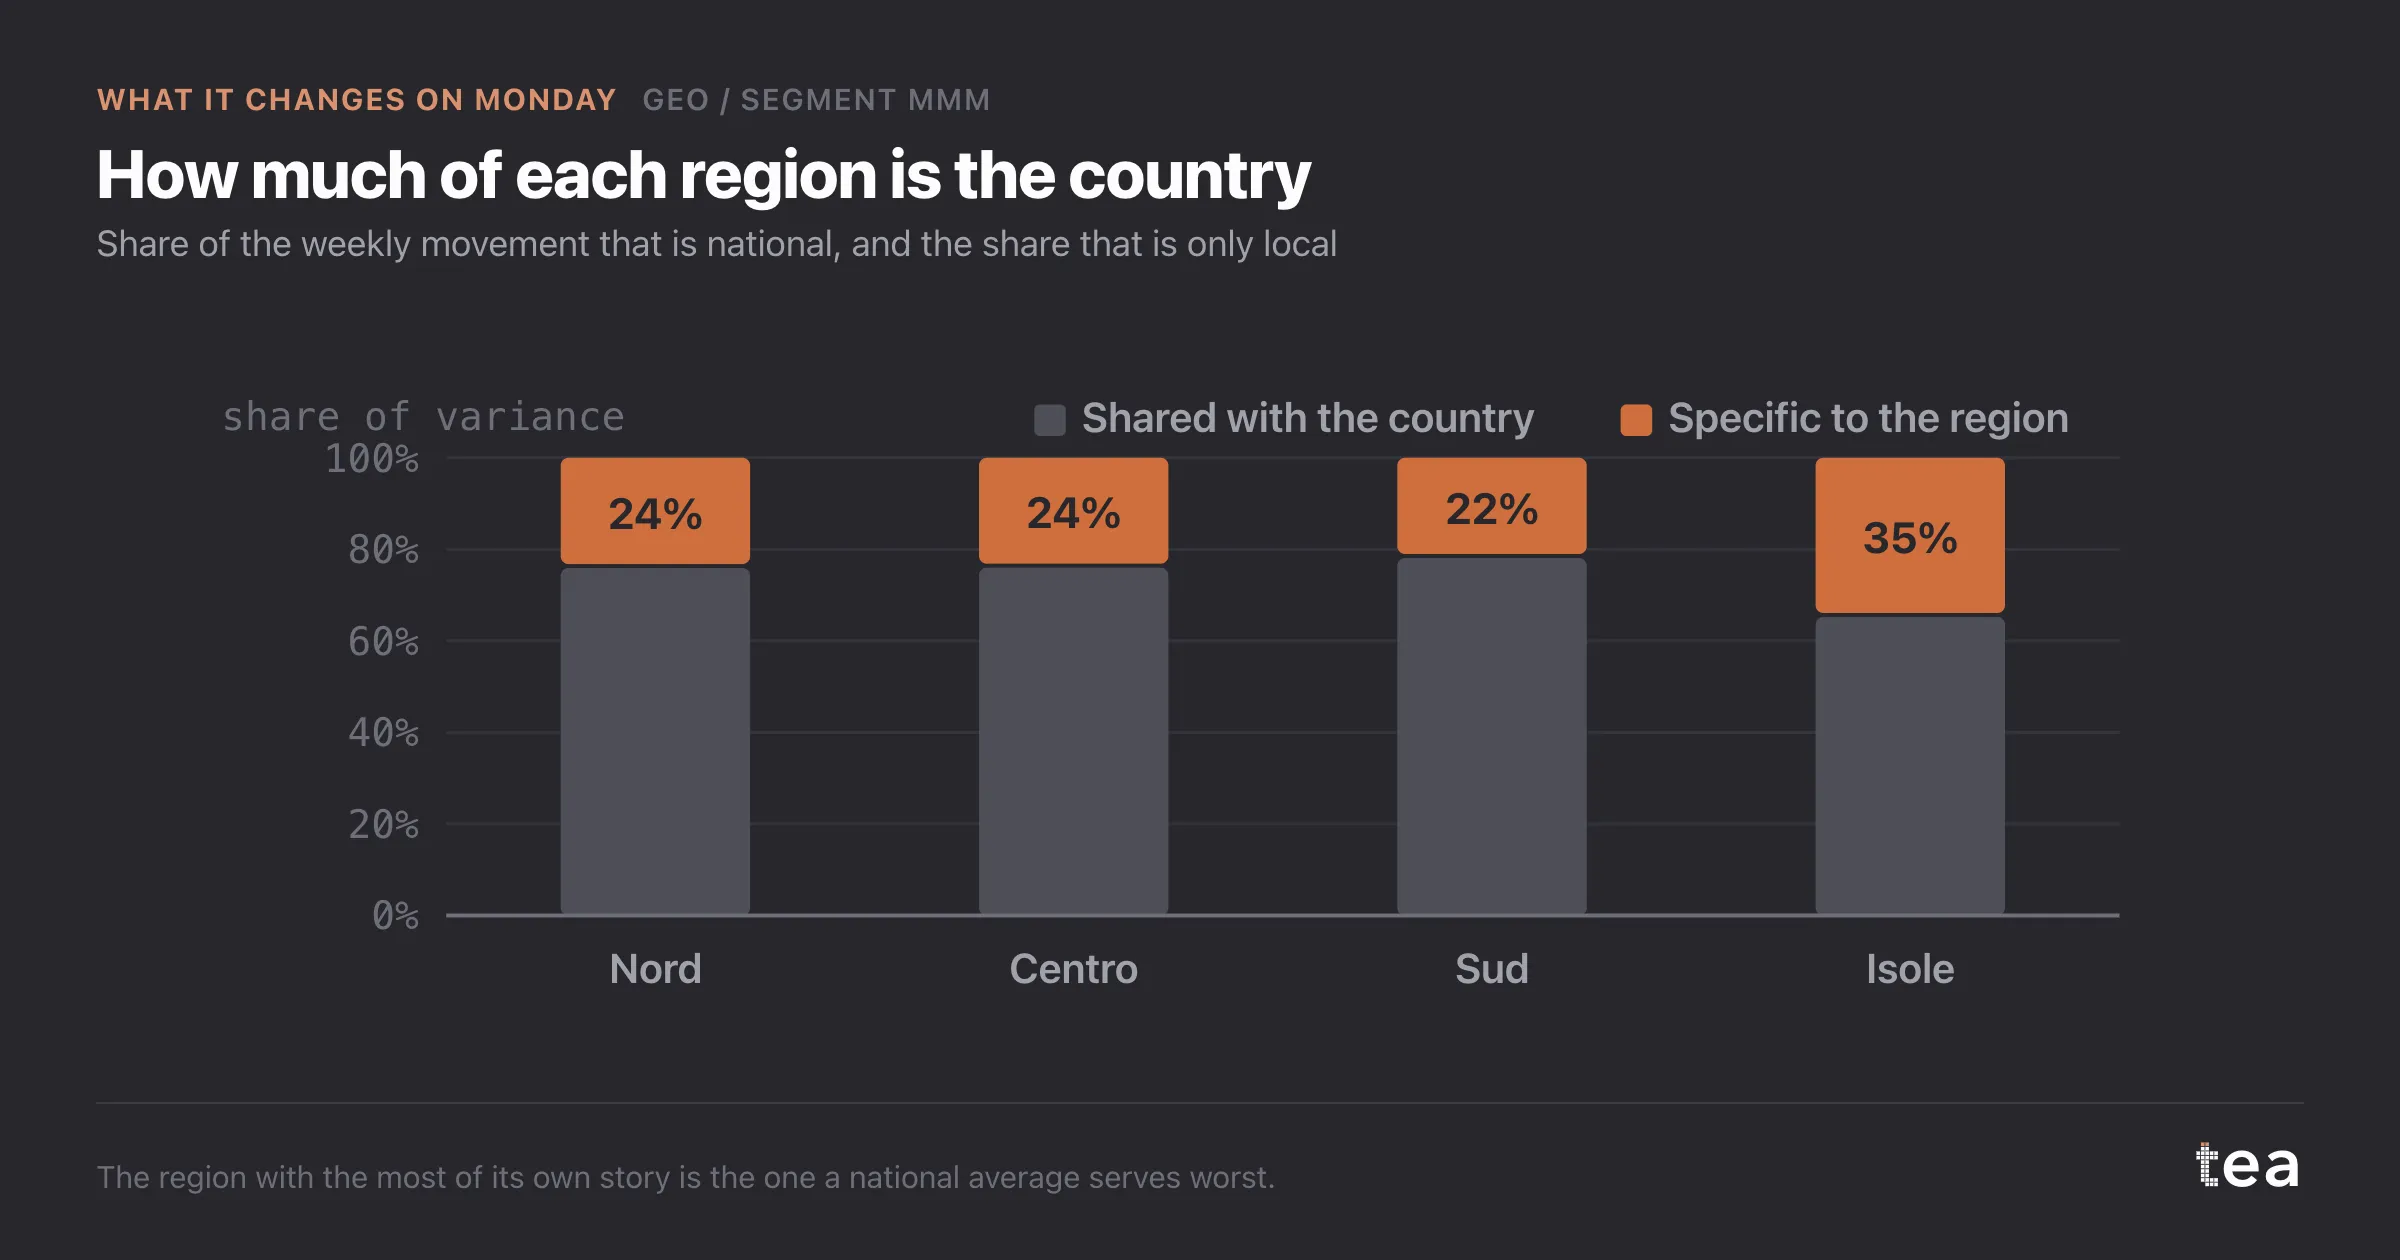
The rest of the diagnostics belong with it. Three regions fit at R² above 0.83. The fourth, the smallest, sits at 0.42, and its estimates deserve correspondingly less weight in any plan.
If you take one habit from this chart, take the question. When someone presents a national effectiveness number, ask what the spread between segments is. If the answer is that nobody looked, the national number is an average whose usefulness is unknown, and it will be applied to every region as if it were a property of the channel.
Tau is also a good early warning on data quality. A tau that is enormous relative to the mean, with wide intervals everywhere, usually means the segments have been split too finely for the history available, and the fix is to aggregate rather than to model harder.
The chart is the actual output of Geo / Segment MMM in TEA.
tea, the product
Your file, this question
Fifteen analyses on a CSV of weekly data, with the intervals and the diagnostics shown, and a plain sentence when the data cannot answer. Free while in beta, by invitation.
Request a place in the beta→tea, the product
Fifteen econometric analyses on your own CSV: Geo / Segment MMM, saturation curves, elasticities, budget allocation. Intervals and diagnostics shown, and a plain sentence when the file cannot answer.
Free while in beta, by invitation.
Request a place in the beta →Liked this? Run it on your own data.
tea runs Geo / Segment MMM and fourteen other analyses on any weekly CSV, in minutes. Free while in beta, by invitation.