Direct-to-consumer skincare brand in Germany and Austria, paid social at €46k a week, asking why returns kept falling.
A composite case, built from the kind of file we see most weeks. A direct-to-consumer skincare brand selling online in Germany and Austria, about €480k of revenue in an ordinary week, with paid social as its largest channel.
Over a year, social spend had crept from about €20k a week to €46k, one launch and one good month at a time. Over the same year, return on ad spend in the platform reports had fallen from about 4 to 2.4. The team had a theory: creative fatigue. The question they brought was: "Is it the creative, or have we simply bought too much social?"
What the data looked like
92 weekly rows. Revenue, paid social spend, paid search spend, influencer spend, a discount depth column and a flag for product launches.
Unlike the TV case, the social column moved a lot, and for reasons that had little to do with demand. Creative tests that ran at €6k a week for a fortnight. Launch weeks at €60k and more. A spell of €15k weeks when a billing problem capped the account. Over 92 weeks spend ranged from €6k to €62k, with plenty of weeks at every level in between.
That spread is what a curve needs. A carryover had been estimated first, so the spend going into the curve was spend as it worked over time rather than as it was booked: half-life just under one week, short, as it usually is for social.
What the curve showed
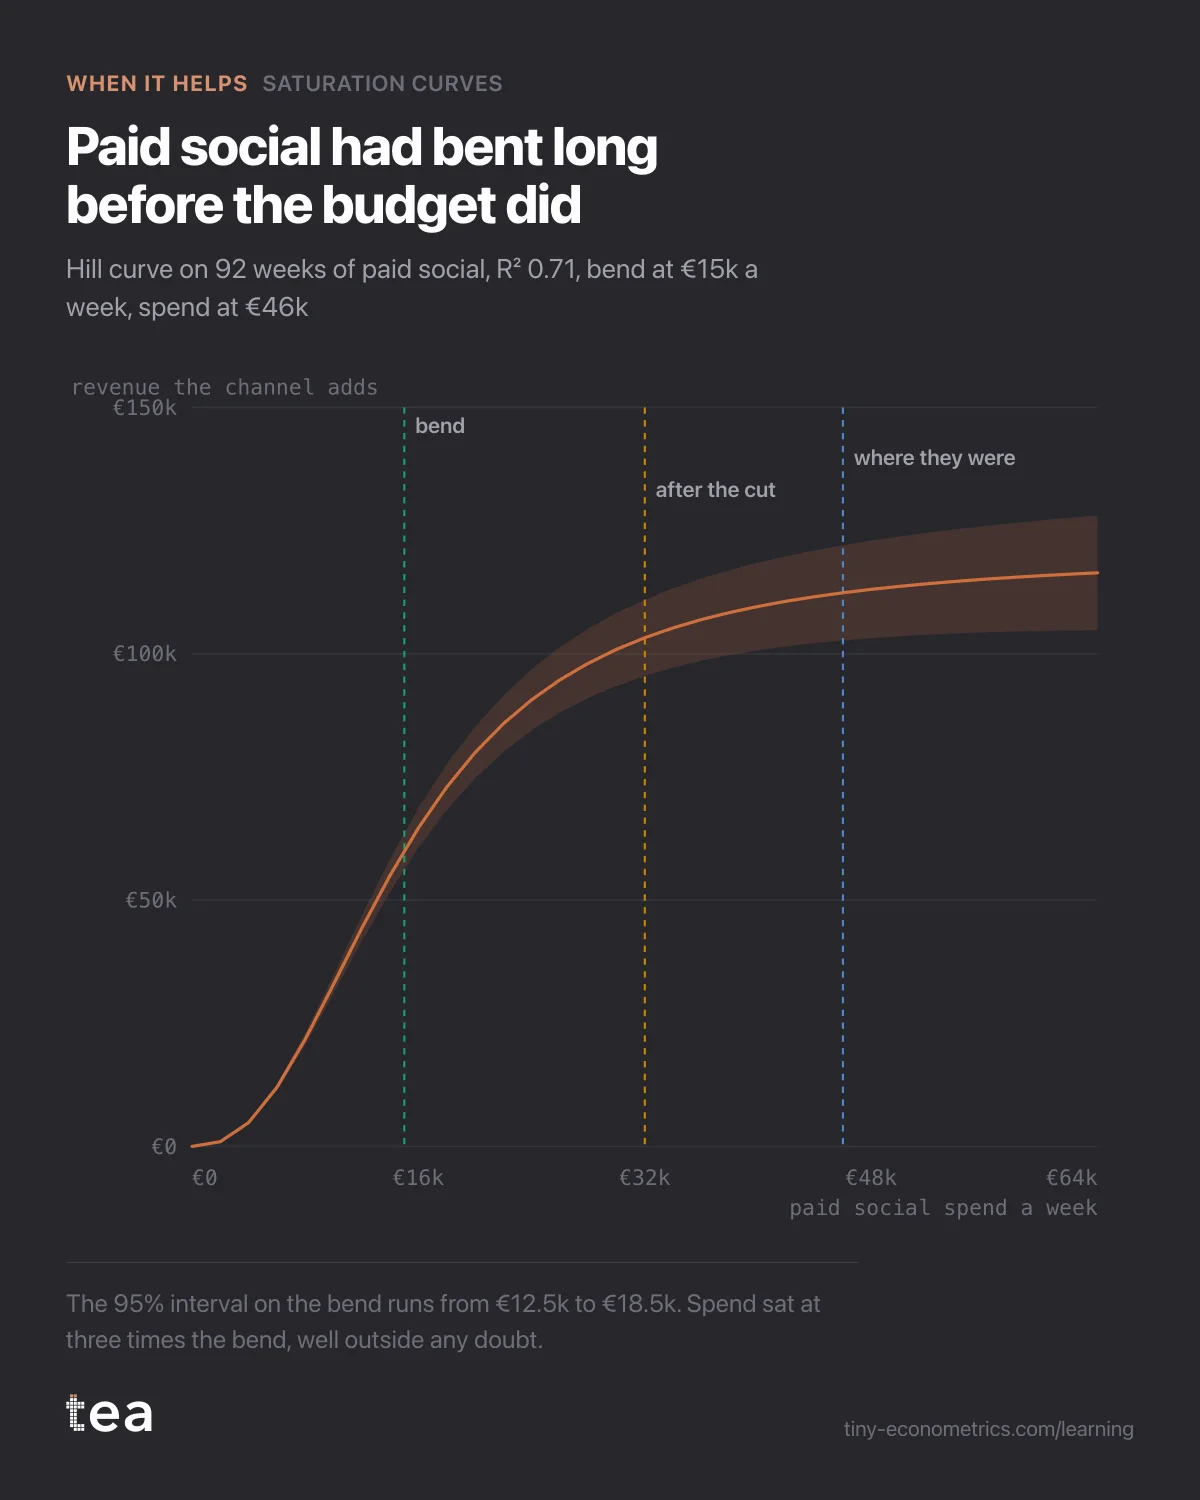
Saturation Curves fitted a Hill curve: revenue from social rises steeply at low spend, bends at a half-saturation point, then flattens towards a ceiling. On this file the fit was good, R² 0.71, and the bend landed at €15k a week, with a 95% interval from €12.5k to €18.5k.
Current spend was €46k. Not near the bend, not on the edge of the interval: three times past it. The usual honesty question, "which side of the bend are we on", had a clear answer here.
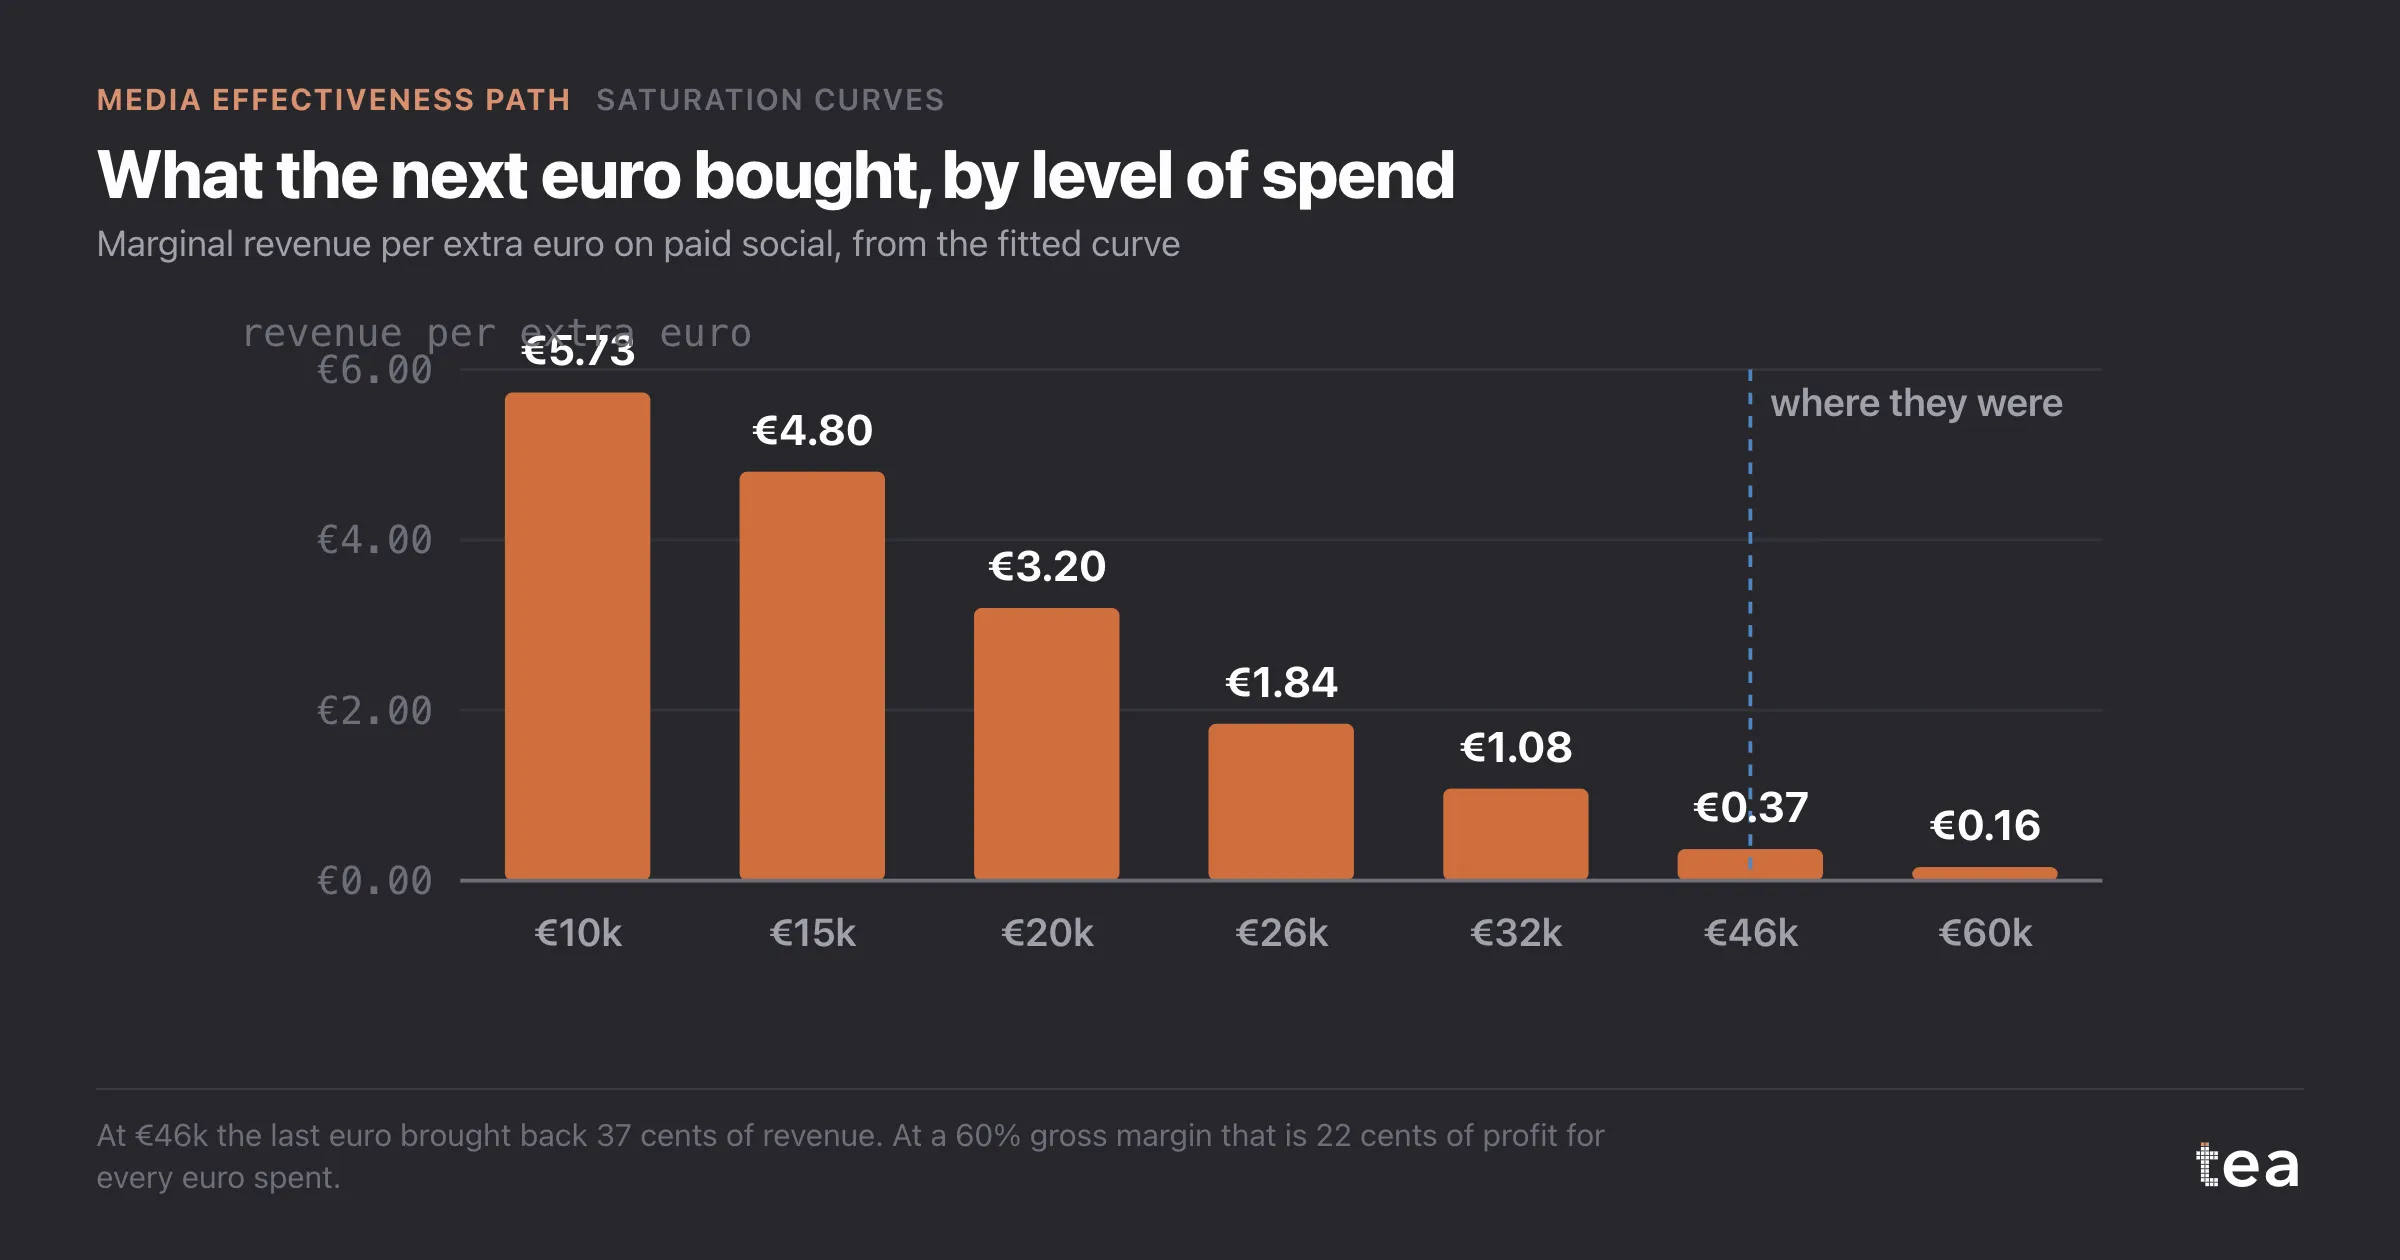
The useful number is not the bend itself but the marginal return, what the next euro buys at each level of spend. The curve gives it directly:
- at €15k a week, about €4.80 of revenue per extra euro;
- at €26k, €1.84;
- at €32k, €1.08;
- at €46k, €0.37.
At a 60% gross margin, the last euro spent at €46k brought back 22 cents of profit. The falling ROAS was not mainly creative. It was arithmetic. The average return at €46k is €2.44, which is almost exactly what the platform was reporting.
The verdict, and the cut
This one helps, and the decision it changed was a cut from €46k to €32k a week, about 30%.
The curve projected that the €14k saved each week would cost about €9.1k of weekly revenue, 1.9% of the total. At a 60% margin that is €5.5k of lost profit against €14k of spend no longer made, so roughly €8.5k a week better off. Over a 26-week half year: €364k less spend, about €237k less revenue, and around €220k more profit.
The team stopped at €32k on purpose. The profit-maximising level on the curve sat nearer €27k, but the further a cut goes, the more it relies on the shape of the curve in a region where they had fewer recent weeks, and launches still needed reach. A cut you can read and extend is better than one you have to reverse.
A quarter later, revenue was 1.6% below the forecast, inside the forecast's own interval of plus or minus 2.5%. Platform ROAS went back to about 3.2, which is what the curve said it would be at €32k. The creative was refreshed too, as planned, but the curve had already explained most of the drop before any new asset went live.
Where the freed €14k a week should go is a separate question, and the Budget Optimization step of the path exists to answer it with every channel's curve at once rather than one at a time.
The lesson
Falling average returns are often a position on a curve, not a problem with the work. If your spend has moved enough to draw the curve, read the marginal return at the level you are actually buying. That is the number that tells you whether the next euro is worth spending, and the average will hide it every time.
tea, the product
Your file, this question
Fifteen analyses on a CSV of weekly data, with the intervals and the diagnostics shown, and a plain sentence when the data cannot answer. Free while in beta, by invitation.
Request a place in the beta→tea, the product
Fifteen econometric analyses on your own CSV: Saturation Curves, saturation curves, elasticities, budget allocation. Intervals and diagnostics shown, and a plain sentence when the file cannot answer.
Free while in beta, by invitation.
Request a place in the beta →Liked this? Run it on your own data.
tea runs Saturation Curves and fourteen other analyses on any weekly CSV, in minutes. Free while in beta, by invitation.
The Media Effectiveness Story
- Adstock and the outdoor burst that was judged on the wrong week
- Why flat always-on spend makes carryover impossible to measure
- A TV saturation curve fitted on only two spend levels
- Paid social past the bend: the saturation curve behind a cheap cut
- Contribution decomposition: when branded search harvests TV demand
- When a budget optimiser says move 60% into one channel (out October 21, 2026)
- A media budget reallocation, executed and read a quarter later (out October 26, 2026)
- Geo MMM: the national average that hid a north and south split (out October 31, 2026)