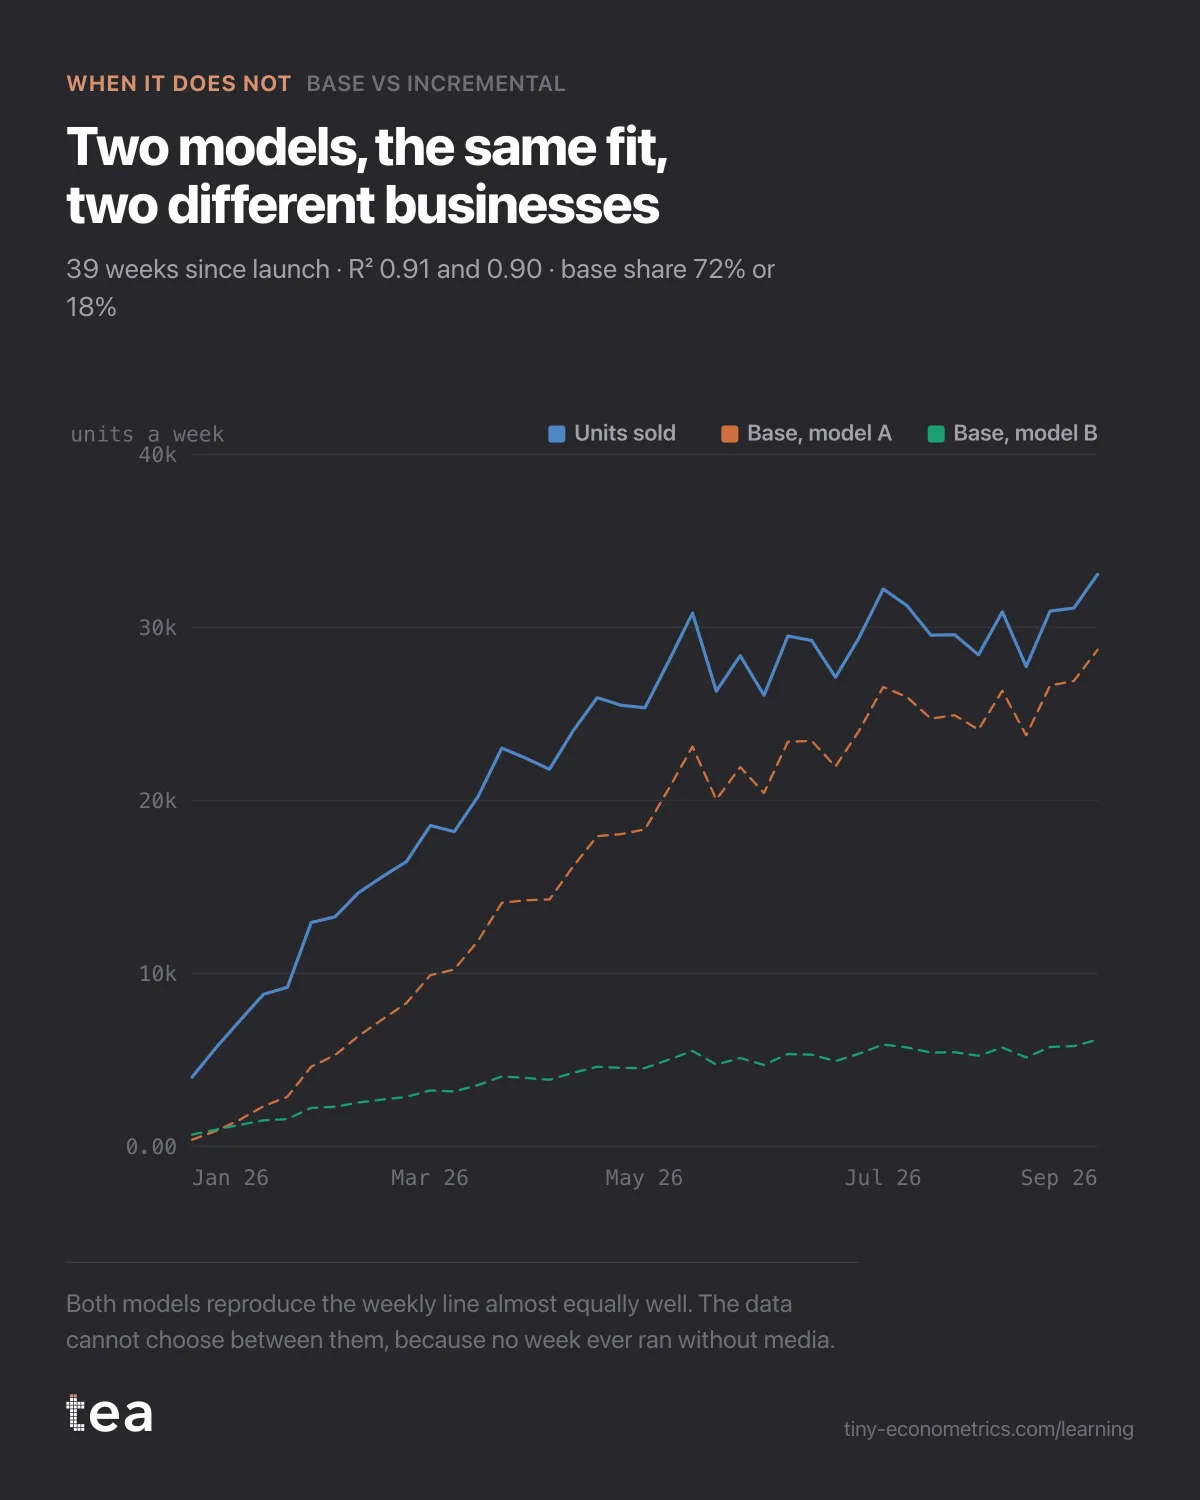
German plant-based protein drink, 39 weeks since launch, media every week, the board asked how much would sell without advertising.
A composite case, built from the kind of file we see most weeks. A plant-based protein drink launched in Germany on 5 January 2026, sold through grocery and drugstores, with a launch budget that ran from the first week.
Nine months in, the board asked the question that ends the Discovery Path: "How much of what we sell would we sell without advertising? We need to know what the brand stands on before we set next year's budget."
It is a good question. This file cannot answer it.
What the file looked like
39 weekly rows, January to September 2026. Units sold, rising from about 4,000 in the first week to about 33,000 in the last, 892,000 in all. Media spend across TV, social and retail media, between €40,000 and €70,000 every single week. Store count, from about 1,200 in January to 4,800 by the summer as listings came through. Average price, nearly constant.
What was missing is the thing the question is about. There is no week without media. There is no week with little media. The lowest spend in the file is €40,000.
Why the split cannot be made
Base vs Incremental builds the base by setting media to zero in a fitted model and reading what is left. In the retailer case that worked, because the file had dark spells and weeks near zero. The model's zero was close to something it had seen.
Here the model's zero is €40,000 away from the nearest observation. Whatever it says about a world with no media is a straight extrapolation from a range of €40,000 to €70,000, with nothing to anchor it.
It is worse than distance. Three things grew together over the same 39 weeks: the number of stores, the awareness that any new brand builds as people meet it, and the cumulative weight of media that adstock carries forward. Each of them can explain a rising sales line. This is the same problem as the TV and search case, with an extra twist: one of the collinear drivers is time itself.
So we fitted three defensible models, as a test of how much the answer depends on the choice:
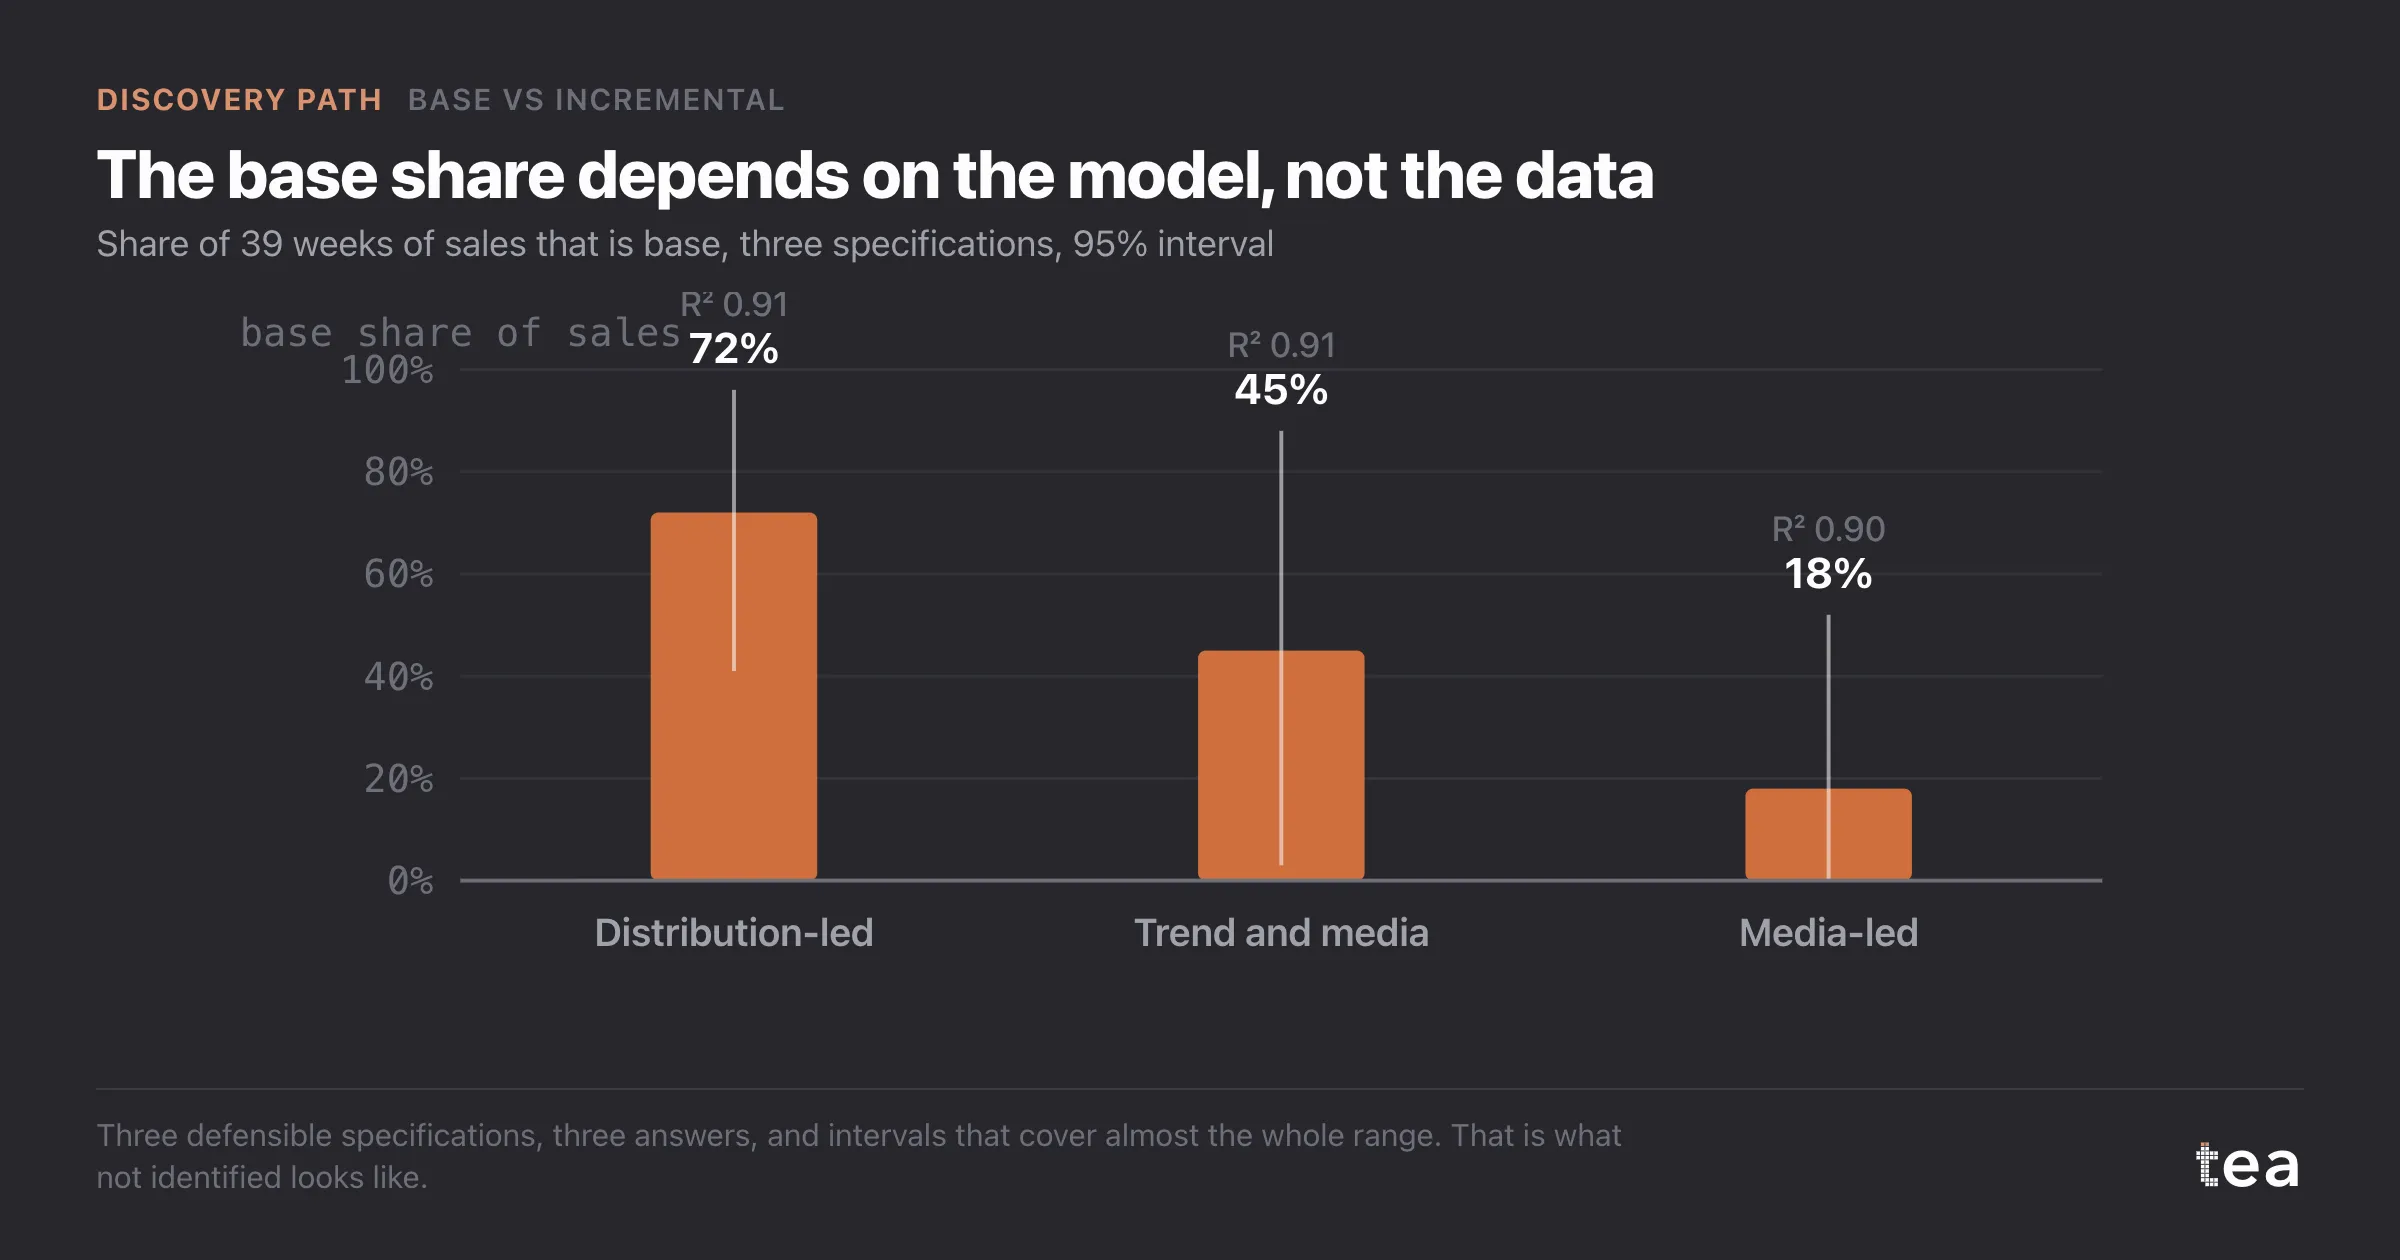
- distribution-led, where store count carries the rise and media adds on top: R² 0.91, base share 72%, interval 41% to 96%;
- trend and media, with a launch curve for awareness: R² 0.91, base share 45%, interval 3% to 88%;
- media-led, where cumulative media builds the brand: R² 0.90, base share 18%, interval 0% to 52%.
All three reproduce the weekly line almost equally well. None of the diagnostics prefers one. The data are equally happy with a brand that stands mostly on its listings and a brand that stands mostly on its advertising.
That is what "not identified" means. It is not a weak estimate that more care would sharpen. It is a question the file does not contain the information to answer.
What would have gone wrong if forced
Any of the three numbers could have been printed with a chart and a decimal point. The board would then have chosen, without knowing it, between "cut media by half, the shelves are doing the work" and "keep spending, the brand is the advertising". Each of those is a reasonable strategy. Neither should be chosen because of which regression someone happened to run first.
What to do instead
The base has to be created, because it was never observed.
Holdout regions. Switch media off in two of the German Nielsen regions for eight to ten weeks, with store counts matched to the rest of the country, and keep it running elsewhere. The gap between the two groups is the incremental effect, measured rather than modelled. With a region column in the file, a geo model can then read what comes out.
Stage the next launch. Austria and Switzerland are on the plan for 2027. Put product on shelf six to eight weeks before media starts. Those weeks are the base for that market, and they say a good deal about this one.
Vary spend on purpose. Even without a full holdout, deliberate low weeks, a few at €10,000 rather than €40,000, give the model a lower anchor.
Wait for distribution to settle. Once store count stops climbing, one of the three drivers stops moving, and the remaining two become easier to separate.
The lesson
A base is not a number hidden in your data. It is a world your data must have visited. If marketing has been on from day one, nobody has seen that world, and the honest next step is to arrange a visit.
tea, the product
Your file, this question
Fifteen analyses on a CSV of weekly data, with the intervals and the diagnostics shown, and a plain sentence when the data cannot answer. Free while in beta, by invitation.
Request a place in the beta→tea, the product
Fifteen econometric analyses on your own CSV: Base vs Incremental, saturation curves, elasticities, budget allocation. Intervals and diagnostics shown, and a plain sentence when the file cannot answer.
Free while in beta, by invitation.
Request a place in the beta →Liked this? Run it on your own data.
tea runs Base vs Incremental and fourteen other analyses on any weekly CSV, in minutes. Free while in beta, by invitation.
The Discovery Story
- Trend analysis with a structural break, and why one line lies
- Subscription growth from marketing, or a slope already there
- Easter, year-on-year comparisons and the quarter that did not fall
- When TV and branded search collinearity defeats the regression
- A sales spike credited to influencers, decomposed by driver
- What would revenue be with zero marketing? The counterfactual year
- Base vs incremental after a launch, with no base in the data