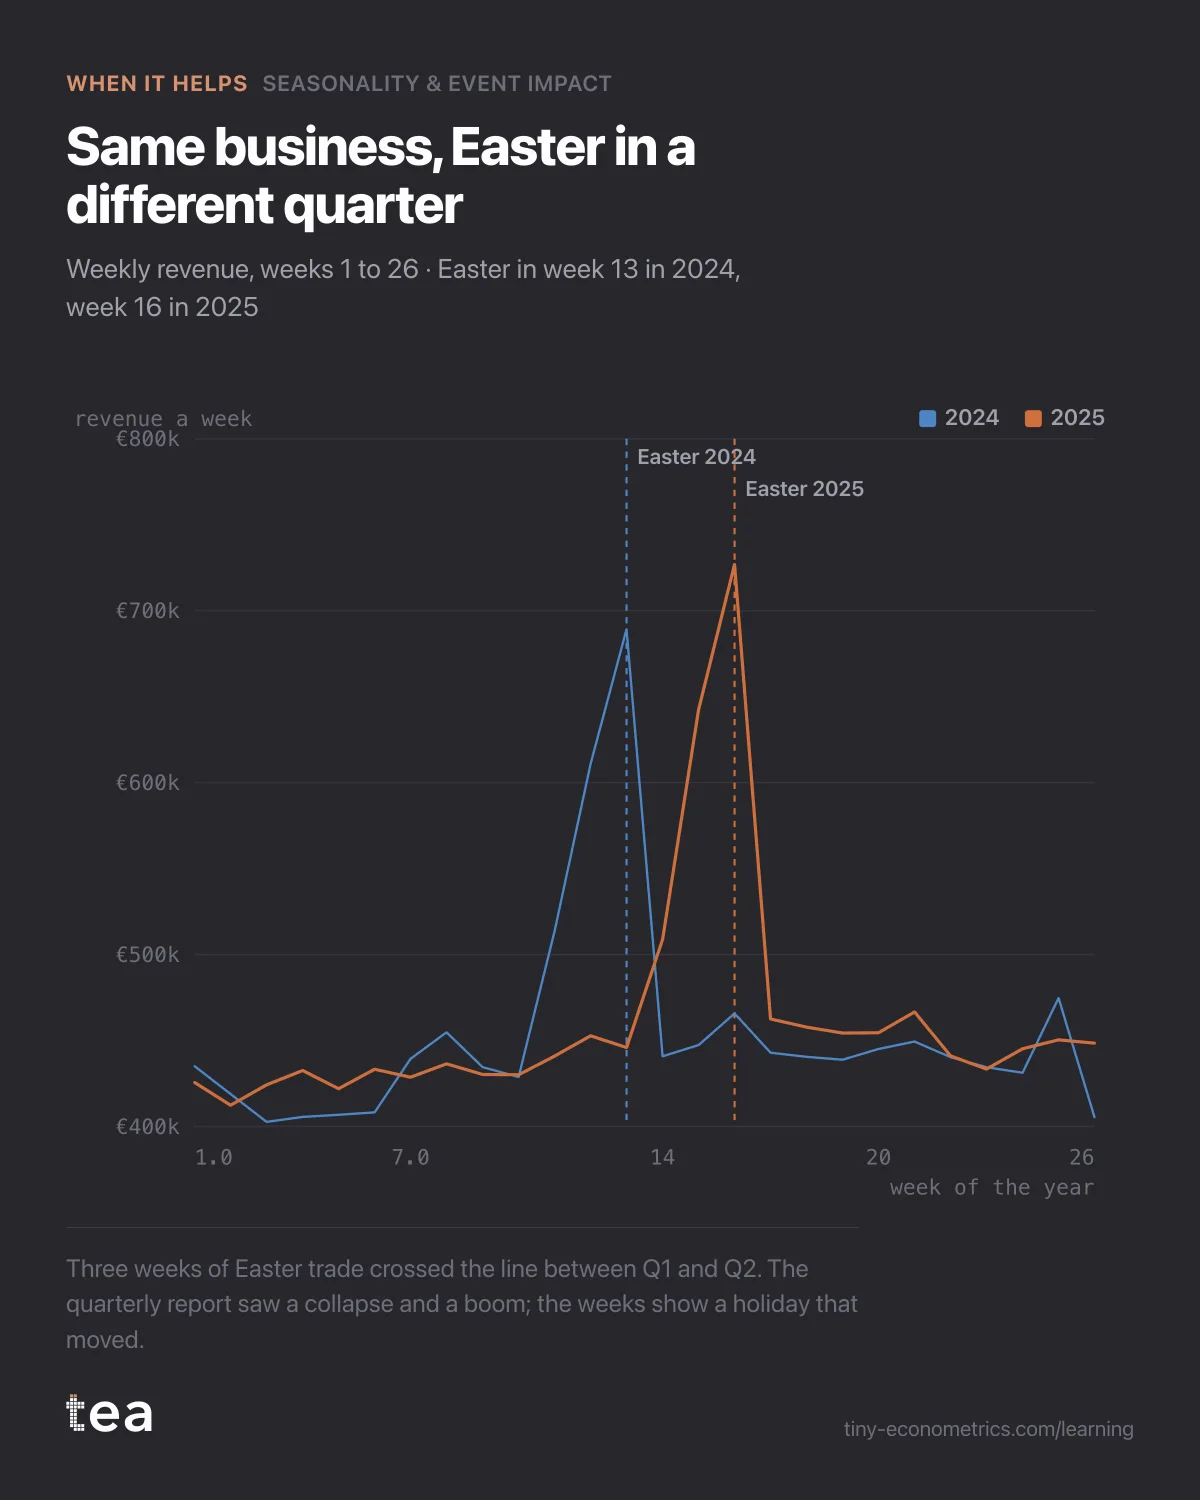
Italian confectionery brand, 182 weeks of revenue, asked whether a new packaging caused a 7% fall in Q1.
A composite case, built from the kind of file we see most weeks. An Italian confectionery brand, chocolate eggs and colomba in spring, biscuits the rest of the year, about €22M of revenue through grocery.
In January 2025 the range moved to new packaging. In April the Q1 numbers arrived, and the commercial director wrote: "Q1 is down 7% on last year. Was it the new packaging? Do we go back?"
Going back had a price. Reprinting and relabelling the old design was quoted at about €180,000, and it would have taken the summer.
What the file looked like
182 weekly rows, January 2022 to June 2025. Revenue, an average price index, weighted distribution and a flag for the weeks with a feature in the retailer leaflet. Price and distribution were steady across the packaging change. Nothing in the file said "Easter".
That is the trap. Easter Sunday fell on 17 April 2022, 9 April 2023, 31 March 2024 and 20 April 2025. In 2024 the whole Easter trade, the two weeks before and the week itself, sat inside Q1. In 2025 all three weeks sat inside Q2.
For a brand that sells chocolate eggs, those three weeks are the biggest of the spring. Moving them from one quarter to another moves the quarterly numbers by more than any packaging could.
What the analysis did
Seasonality & Event Impact separates the regular calendar from the dated events. The regular calendar is the shape every year shares: the slow spring, the summer dip, the autumn climb. The dated events are the ones that move. Easter goes in as an event dummy, a column that is 1 in the three Easter weeks of each year, on their actual dates, and 0 everywhere else.
Because Easter landed in a different week in each of the four years, the model can tell the holiday apart from the week of the year. If Easter always fell in week 15, the two would be the same column and nothing could separate them. Here the dates wander across 21 days, and that wandering is exactly what identifies the effect.
The estimate: the three Easter weeks run 38% above an ordinary week of the same season, with a 95% interval from 31% to 45%. The trend underneath was held fixed from the first step of the Discovery Path, as in the subscription case, so the holiday could not borrow growth from it.
The quarterly story, retold
With Easter taken out of both years and the comparison redone on what is left:
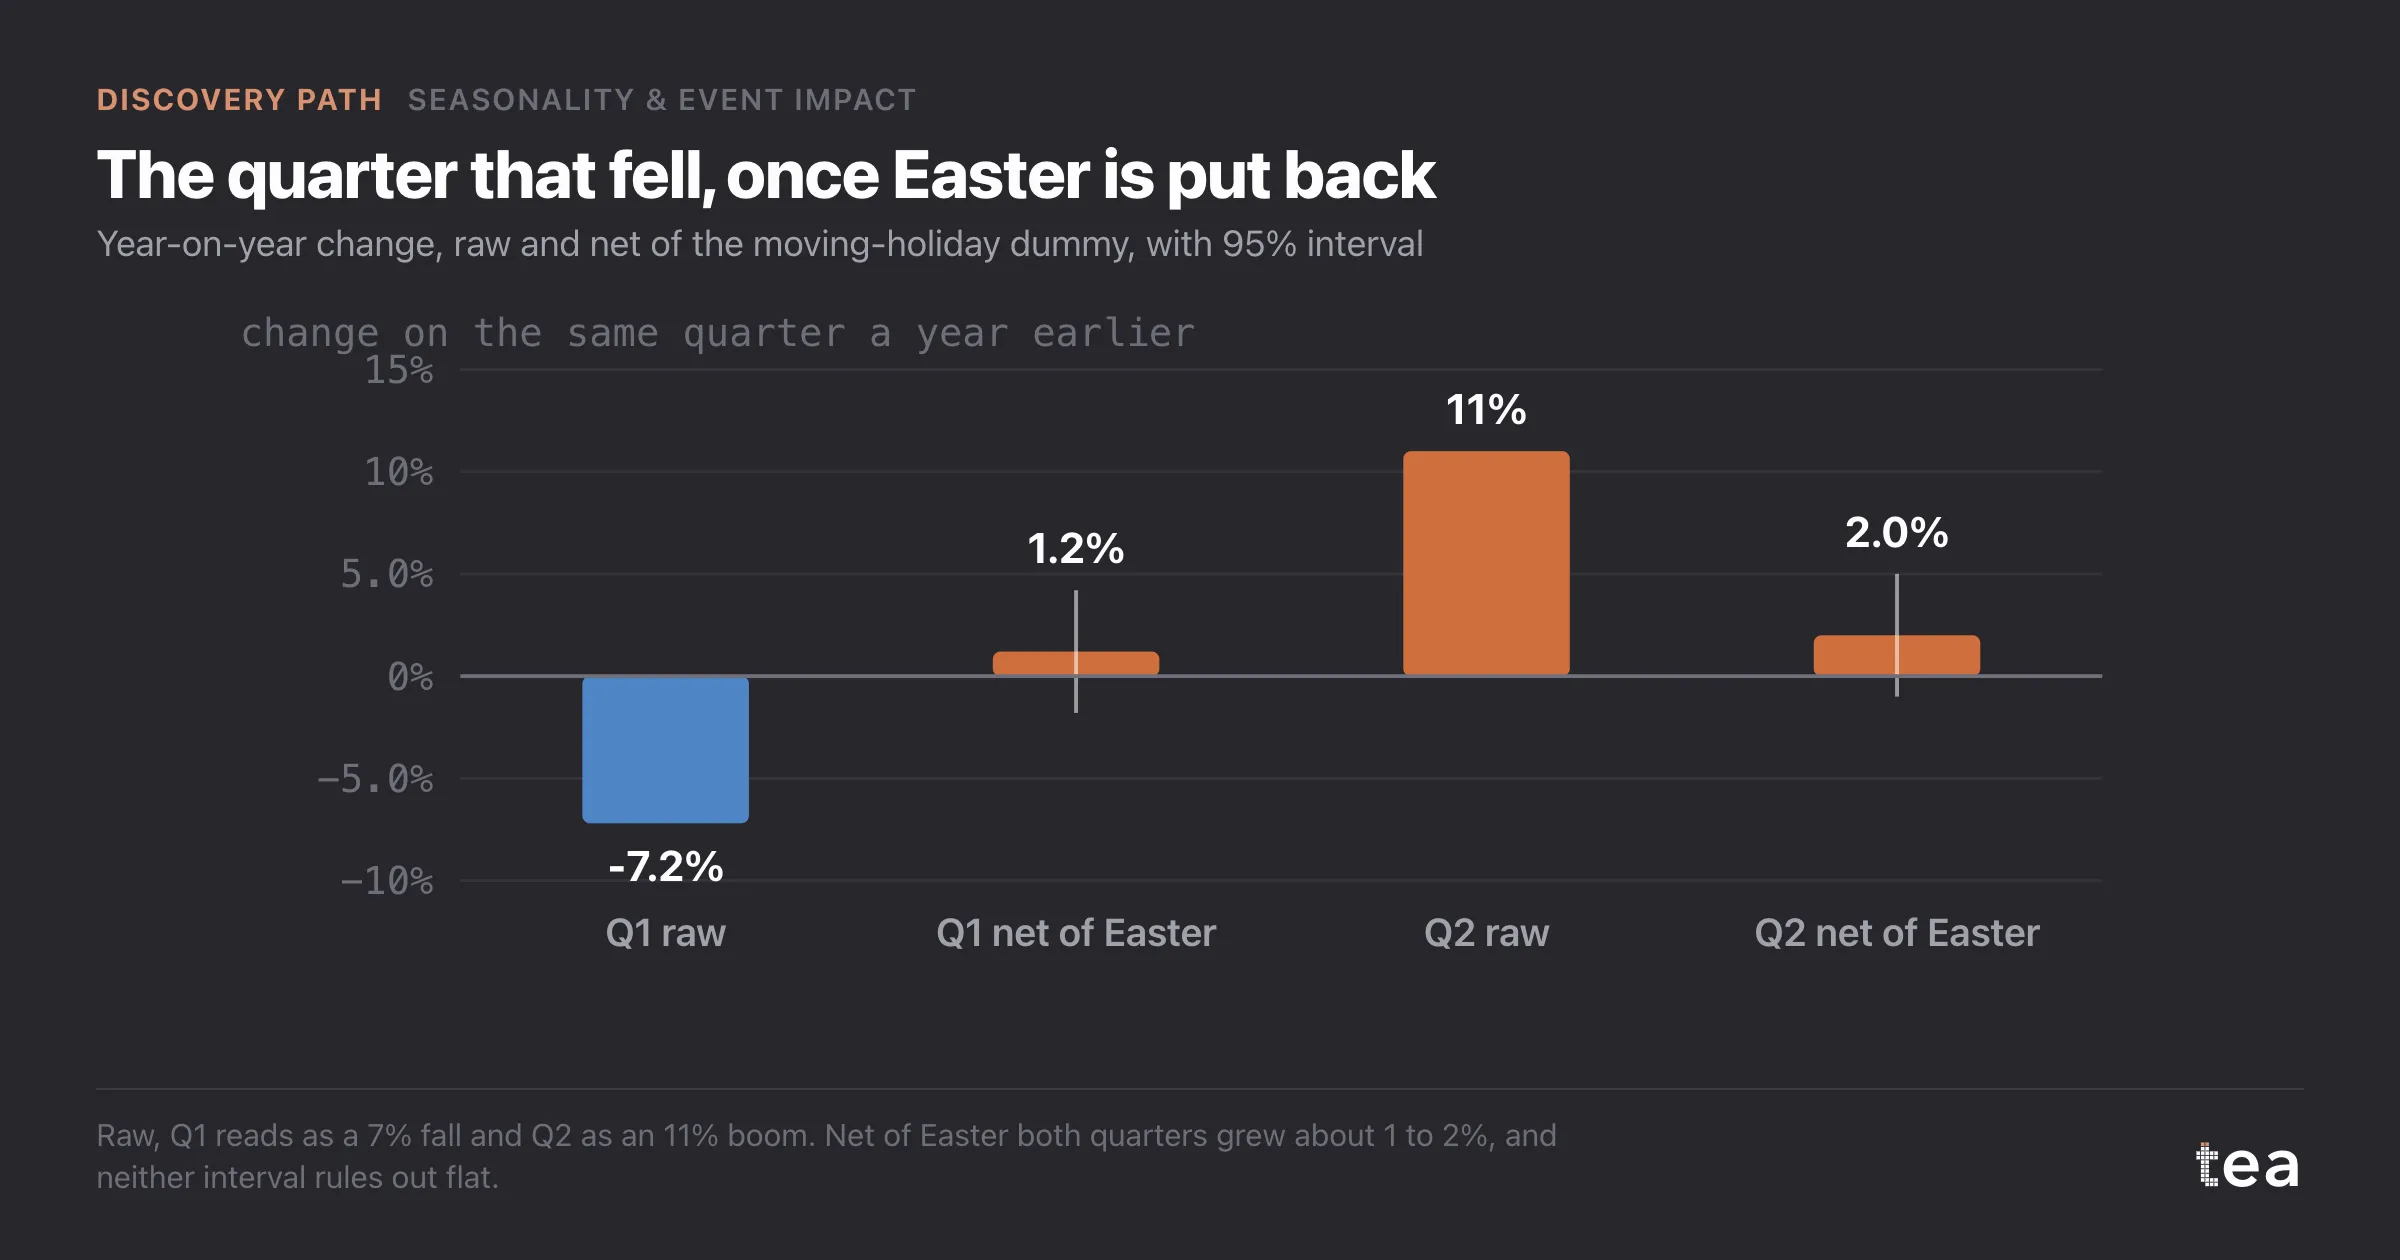
- Q1 2025 against Q1 2024: -7.2% raw, +1.2% net of Easter, interval -1.8% to +4.2%;
- Q2 2025 against Q2 2024: +11.0% raw, +2.0% net of Easter, interval -1.0% to +5.0%.
The fall in Q1 was Easter leaving the quarter. The boom in Q2, which nobody had asked about yet, was Easter arriving. Underneath both, the business grew by one to two per cent in each quarter, and neither interval rules out flat.
That last point was said out loud, because it cuts both ways. The analysis does not show that the new packaging worked. It shows that the data contain no evidence it failed, and that the 7% fall was never the packaging's to explain.
The decision it changed
The reversal was shelved and the €180,000 stayed in the budget.
Two smaller changes followed. The quarterly reporting template now carries an "Easter-adjusted" line next to the raw one, so next year's comparison of an early Easter, 5 April 2026, against a late one is not read raw. And the Q2 bonus conversation, which had started on the strength of +11%, was held on the +2%.
The same mechanics apply to anything that moves on the calendar: Ramadan, Chinese New Year, Black Friday against the start of December, a bank holiday that falls on a Monday one year and a Thursday the next. Any comparison of fixed periods across moving events is a comparison of the events, not the business.
The lesson
Before reading a year-on-year number, list the dated events that changed position between the two periods and put them in the file as their own columns. A quarter is an accounting boundary. Your customers do not know where it is.
tea, the product
Your file, this question
Fifteen analyses on a CSV of weekly data, with the intervals and the diagnostics shown, and a plain sentence when the data cannot answer. Free while in beta, by invitation.
Request a place in the beta→tea, the product
Fifteen econometric analyses on your own CSV: Seasonality & Event Impact, saturation curves, elasticities, budget allocation. Intervals and diagnostics shown, and a plain sentence when the file cannot answer.
Free while in beta, by invitation.
Request a place in the beta →Liked this? Run it on your own data.
tea runs Seasonality & Event Impact and fourteen other analyses on any weekly CSV, in minutes. Free while in beta, by invitation.
The Discovery Path
- Trend analysis with a structural break, and why one line lies
- Subscription growth from marketing, or a slope already there
- Easter, year-on-year comparisons and the quarter that did not fall
- When TV and branded search collinearity defeats the regression (out October 12, 2026)
- A sales spike credited to influencers, decomposed by driver (out October 17, 2026)
- What would revenue be with zero marketing? The counterfactual year (out October 22, 2026)
- Base vs incremental after a launch, with no base in the data (out October 27, 2026)