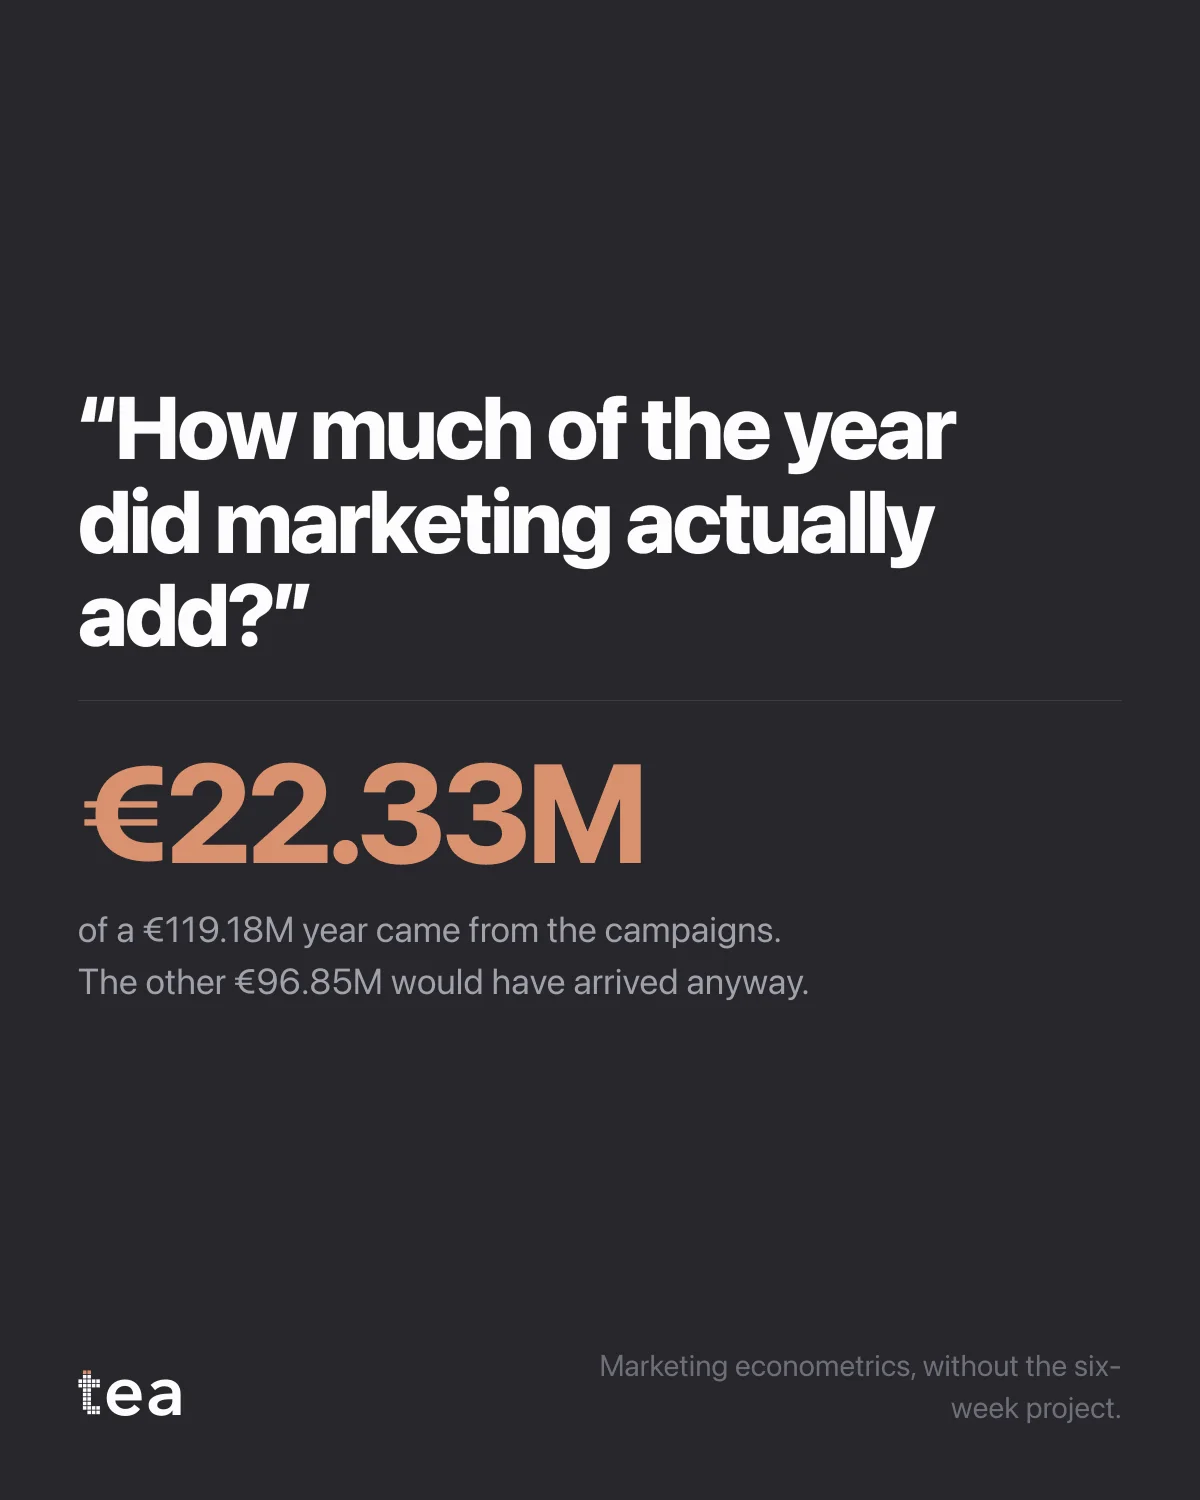
"How much of the year did marketing actually add?"
It is the question every client asks once a year, usually in the last ten minutes of a meeting about something else. And the honest answer, in most agencies, takes six weeks and a specialist supplier.
On the demo dataset in our product the answer is €22.33M of a €119.18M year. The other €96.85M was arriving whether or not anybody ran a campaign.
Two things about that number are worth more than the number itself.
The first is that it is a split, not a total. Nobody has been told their marketing is worth €119M and nobody has been told it is worth nothing. The year has been divided into the part that responded to the plan and the part that did not, and both parts are in euros.
The second is that it comes with everything needed to argue with it. The coefficient behind each driver, its standard error, its p-value, the variance inflation factor, the residuals. If a client's analyst wants to take it apart, the pieces are there. That is a very different conversation from defending a number that came out of a model nobody in the room can open.
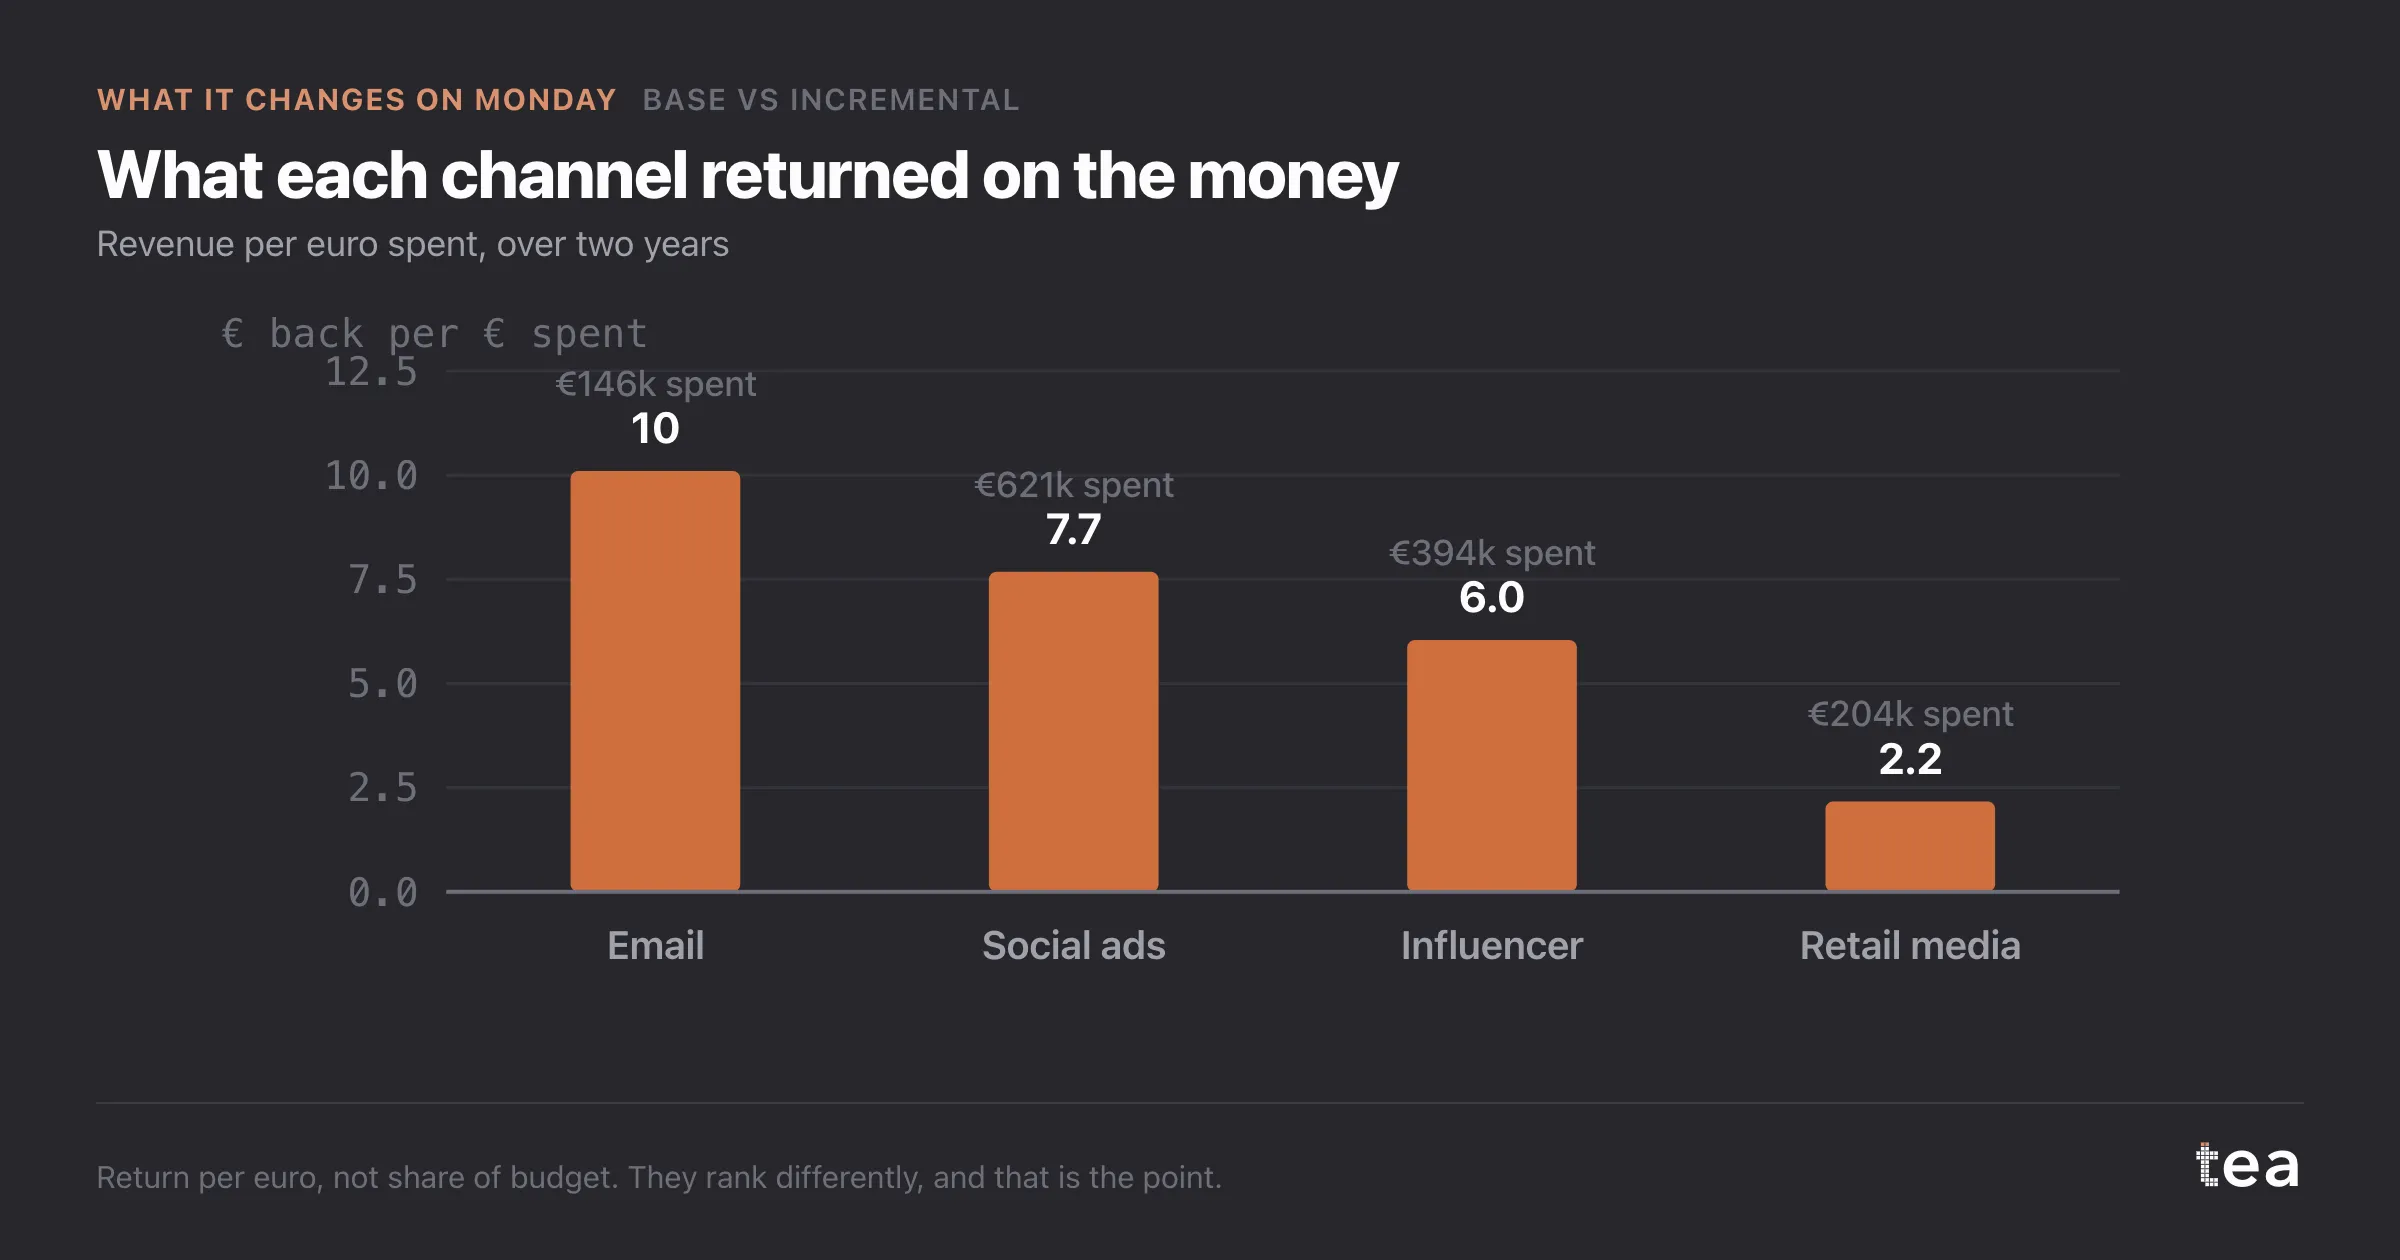
Why this matters for an agency specifically: the six week project is not just a cost, it is a timing problem. The question arrives in the meeting, and the answer arrives after the decision. By the time the study lands, the budget has been set, the plan has been signed, and the analysis becomes a report about the past rather than an input to the future.
Compressing that to the length of a conversation changes what the work is for. Not a study, a capability. Not a supplier's deliverable, an answer you have.
There is a version of this that is dangerous, and it is worth naming. Fast answers with no intervals, no diagnostics and no limits are worse than slow ones, because they are just as confident and nobody can check them. Speed is only an asset when the honesty comes with it.
That is the whole design brief we have been working to: the answer in the meeting, with the working attached.
One practical note for anyone thinking about the workflow rather than the claim. The input is the client's own weekly file: a date, the KPI, the spend or GRPs by driver, and whatever controls the business knows matter. No new taxonomy, no tagging project, no data warehouse programme. If the media plan exists in a spreadsheet, and the KPI exists in another one, the analysis has what it needs.
That is also the honest limit. A model can only separate drivers that behaved differently from each other at some point. A plan where everything ran at once, every week, for two years, will not produce this chart no matter how good the method is, and the right answer in that case is to say so rather than to produce a split.